Overview
Dashboard provides information about throughput, file processing, threat analysis, and resource utilization of the manager and collectors. It provides general information about system and application performance and displays threats detected in the last 24 hours.
Host Statuses
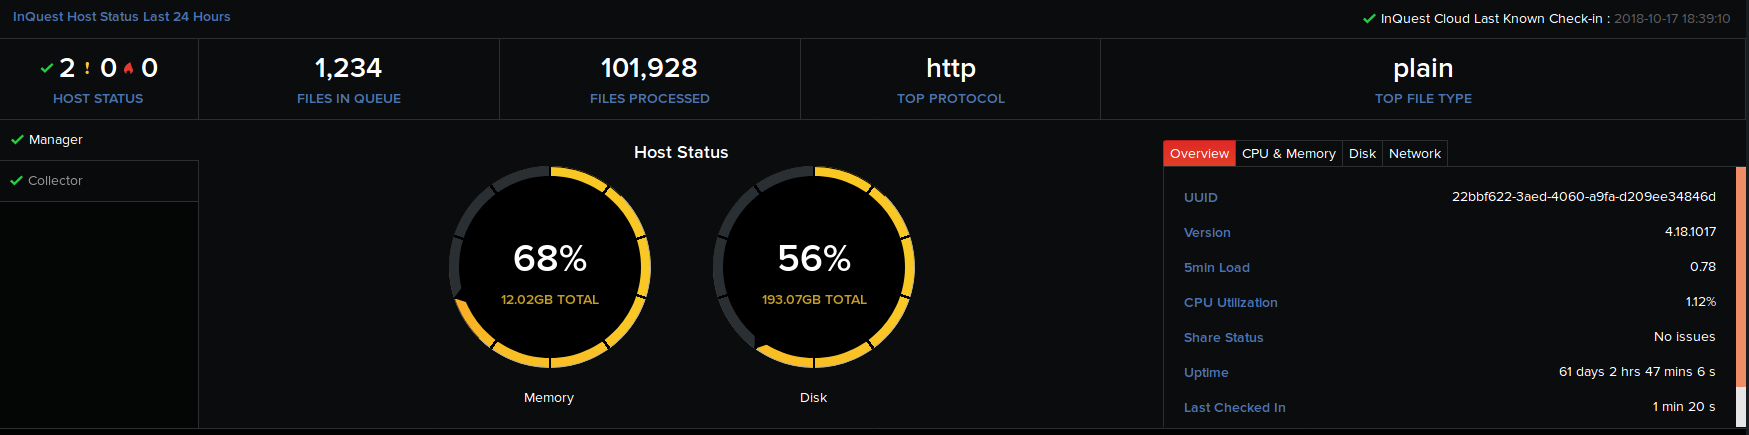
Host Status displays the latest number of hosts, files queued and processed while being transferred to your systems through the top network protocol (HTTP or SMTP), listing the top file type processed by MetaDefender NDR. Click Expand Host Status to view information on the host names, memory, disk utilization, UUID, code version, CPU load and utilization, uptime, server time, and the amount of data transmitted and received through the network.
Host statuses are displayed in the following three different color codes, which indicates the overall health of the servers:


Latest Files and Protocols
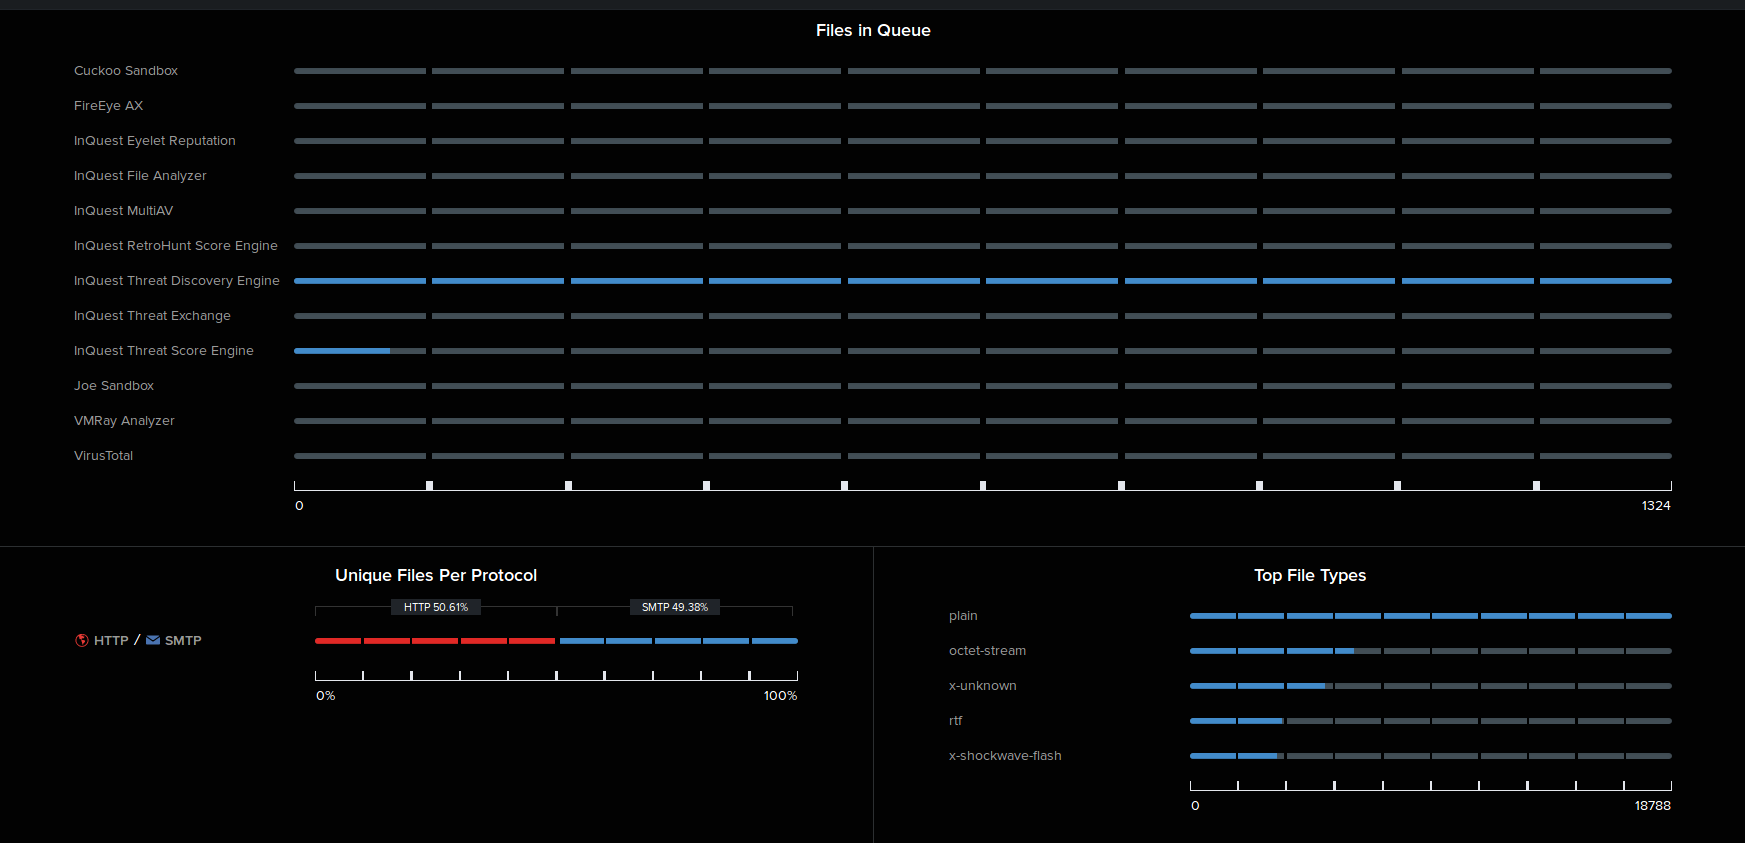
High-level count of files in the queue being analyzed and processed by the built-in signature-based scanners and the enabled third-party integrations, percentage of the top protocols – HTTP and SMTP involved in file transfers, top file types being processed (with their numbers) are displayed in the form of bar graphs. Tip: Hover over an item on the bar graph to view a tooltip displaying the number of files in queue/being processed, and the file types.
Note: Click Collapse Host Status to hide the detailed view of the host status.
Communication with the MetaDefender NDR Cloud
MetaDefender NDR manager communicates regularly with the MetaDefender NDR Cloud for any published updates. The MetaDefender NDR Cloud Last Known Check-in option on the top-right corner of the dashboard displays the last instance when the MetaDefender NDR manager communicated with the MetaDefender NDR Cloud. Note: This option appears on the dashboard only after MetaDefender NDR Automatic Updates are enabled in Administration > Integrations.
Tip: Hover over this option to view a tooltip displaying the last date and time when MetaDefender NDR manager communicated and received codepacks, feedpacks, and sigpacks from the Cloud.
Latest Threat Origins (All Policies)
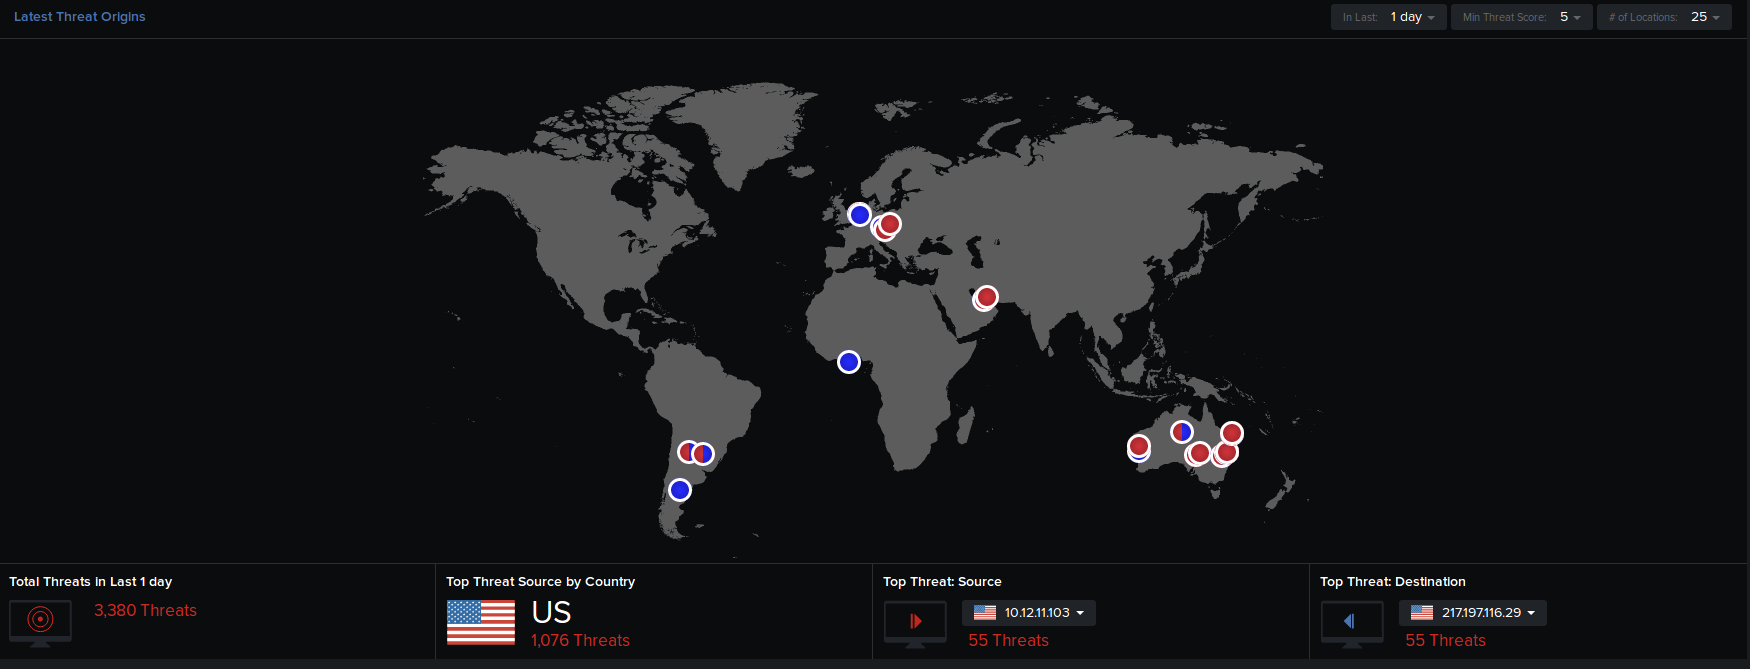
The World map displays red nodes representing the source IP locations of the latest threats. For a selected timeframe, threat score, and the number of locations specified in the drop-down menu, you can view the total number of threats, country listed as the top threat source, source and destination IP addresses of the top threats and their respective number of threats.
Tip: Hover over a node to view a tooltip text of the format AU: HTTP / SMTP : 5 / 0. It indicates AU is the country code for Australia and 5 threats are originating from or targeting Australia via the HTTP protocol.
Click on a red node to view its connected white nodes representing the destination IP locations of the threats, and an additional right pane that displays the instance of the threat, threat score, connected source and destination IP addresses, number of events that occurred, and the protocol involved in the session. Click View Details to view further details of the session on the Analysis page.
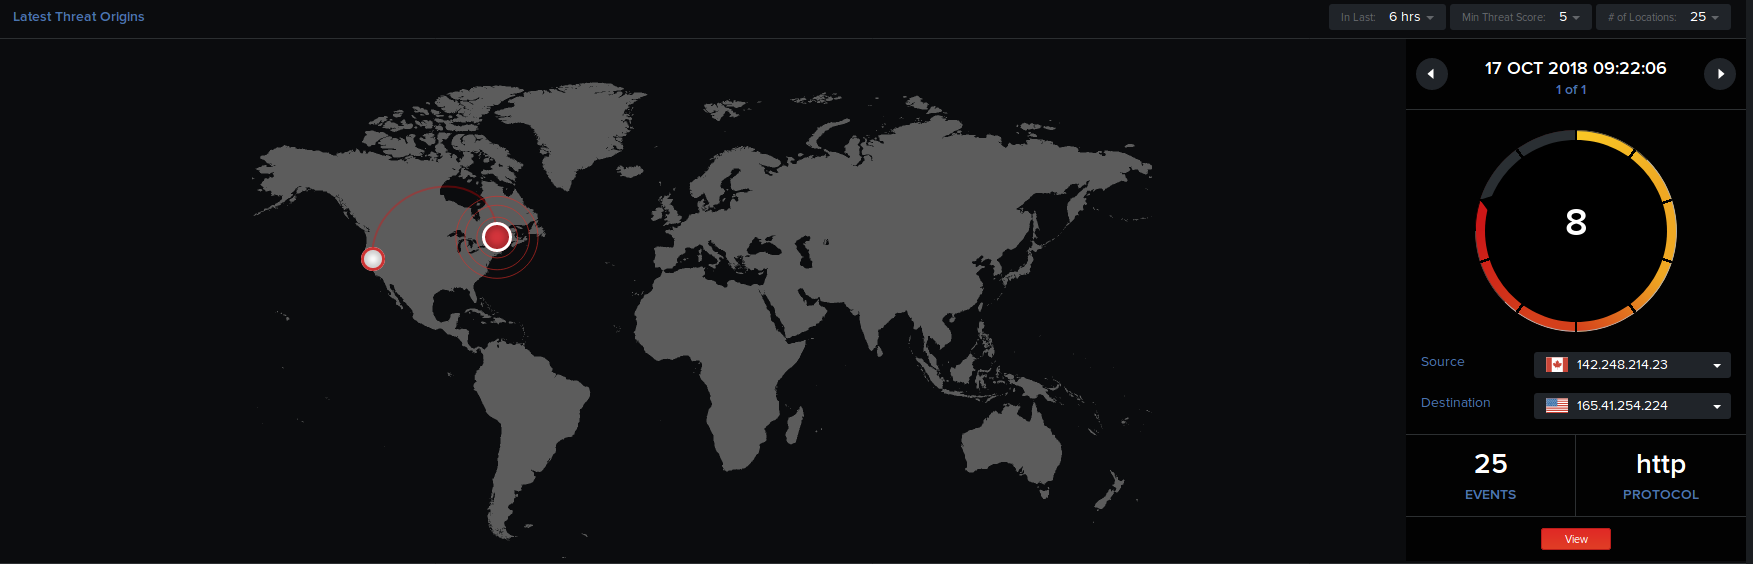
Click anywhere on the map to hide this right pane and get back to the map display on the dashboard. Note: By default, data on the World map automatically refreshes every 2 minutes. To manually refresh data, single-click in the map area.
Event Counts Last 24 Hours (All Policies)
Number of events pertaining to threats, data-loss, command and control IP addresses, and DNS resolutions in the last 24 hours are listed hourly in graphical form.
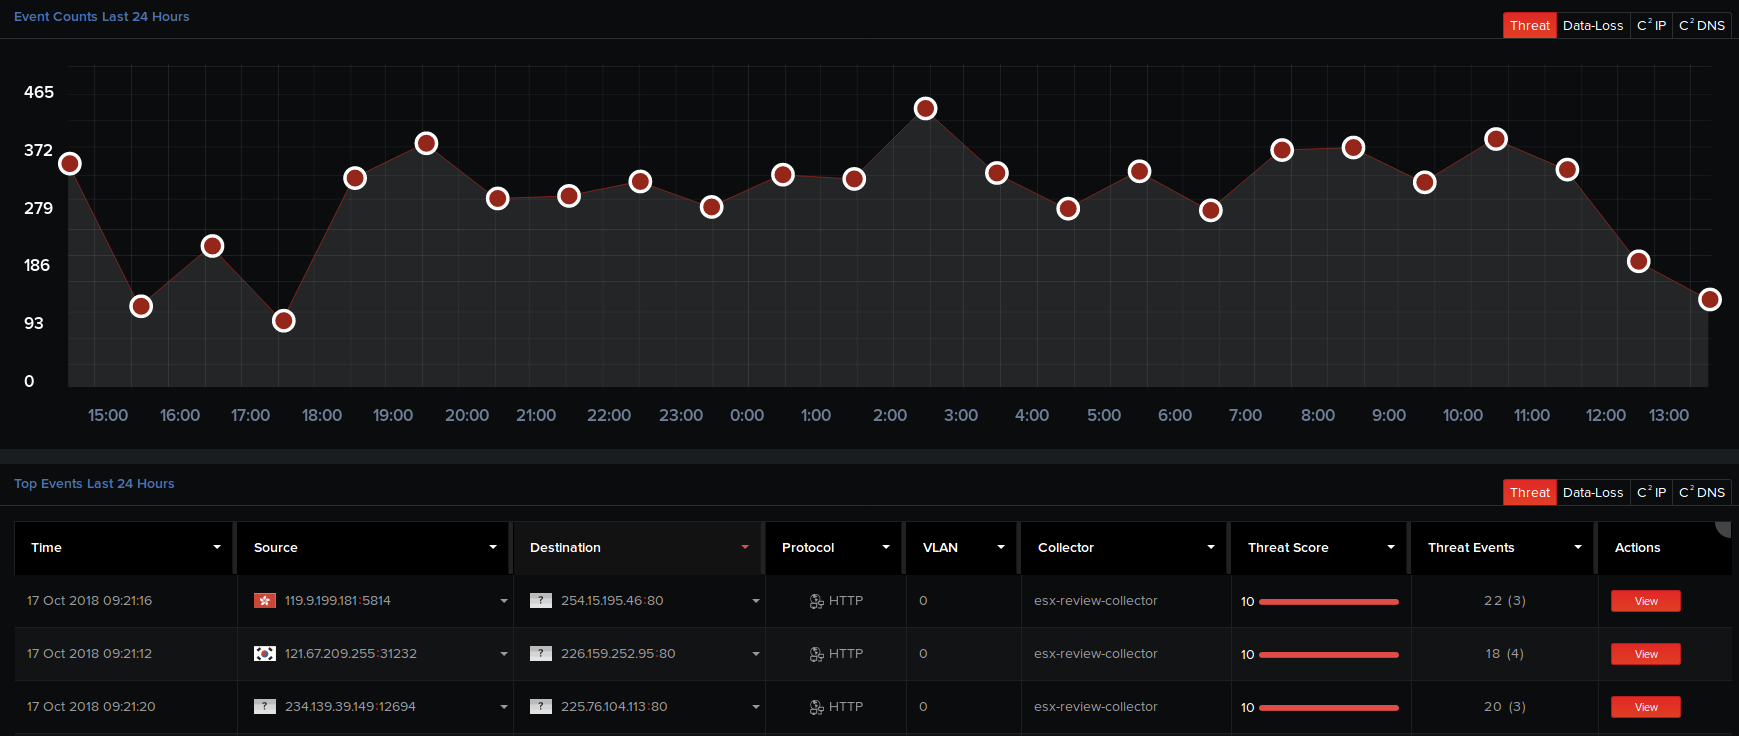
Tip: Hover over a node at a particular instance. A tooltip displays the number of events that occurred at that instance.
Furthermore, you can view the basic details of the top 10 events detected in the last 24 hours in a tabular form. On the Threat tab, click View corresponding to a threat to view its detailed analysis report on the Analysis page. On the C2 IP and C2 DNS tabs, click View to view detailed reports on the IP connections and DNS lookups respectively.
For a selected tab, click View All at the bottom of the page to view all its top events detected in the last 24 hours on the Analysis page.
Tips:
- Hover over the grey area at the top-right edge of this table header, then click the required tabular columns to hide them from the table. A drop-down menu appears listing all the tabular column header names. Click on the icon corresponding to a tabular column name to hide it from the table. The icon will now be changed to and the column is removed from the page display. You can toggle between these icon clicks to display or hide the required columns. You can also click the available up and down arrows in this menu to prioritize and arrange the column headers in the table as required. To revert to the default display where all the columns are set to be displayed, click Reset.
- Click on any column in the table header to arrange and display the column items in a particular sequence (alphabetical, ascending, or descending order).