
The MetaDefender ICAP Server dashboard gives you a centralized view of every request your MetaDefender ICAP Server instances inspected for web, email, and other ICAP-connected traffic, and the health of the instances doing the inspecting.
Use dashboard widgets to see how many requests were blocked or sanitized, why, and confirm your instances are connected and licensed.
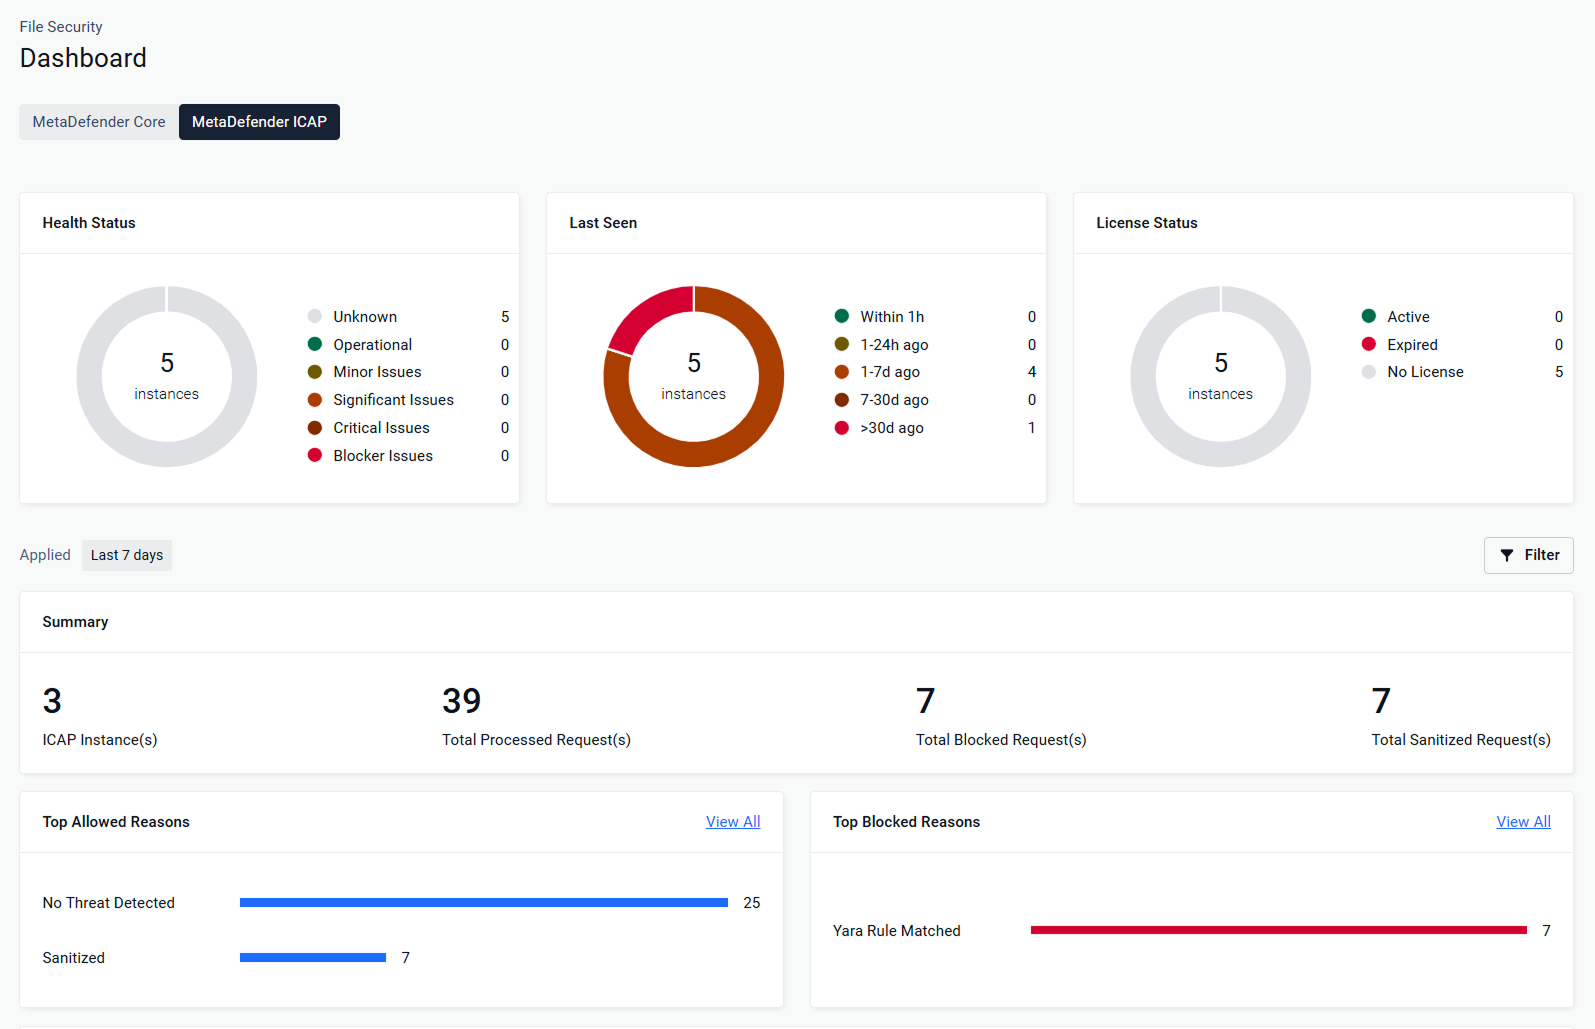
Open MetaDefender ICAP Server Dashboard
In the left navigation, select File Security > Dashboard
Select the MetaDefender ICAP tab
Use the controls above the Summary section to scope the activity widgets:

Control | What It Does |
|---|---|
Applied timeframe | Sets the reporting window for all activity widgets (default: Last 7 days). Widen the timeframe before concluding a widget is empty. |
Filter | Narrows the view to specific instances or groups. |
Monitor Product Instance Health
The three widgets at the top of the dashboard give a real-time overview of your enrolled MetaDefender ICAP Server instances.
Each widget shows the total number of instances in its center; hover over a segment to see the count for that category.
Widget | What It Shows |
|---|---|
Health Status 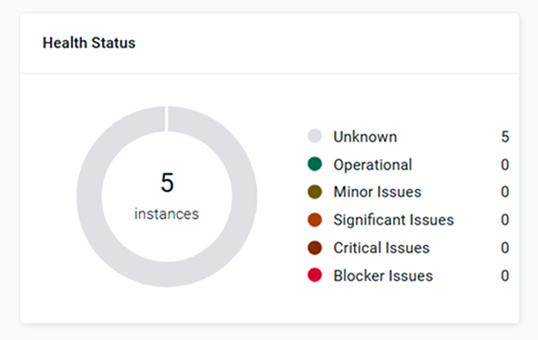 | Instances grouped by their reported health |
Last Seen 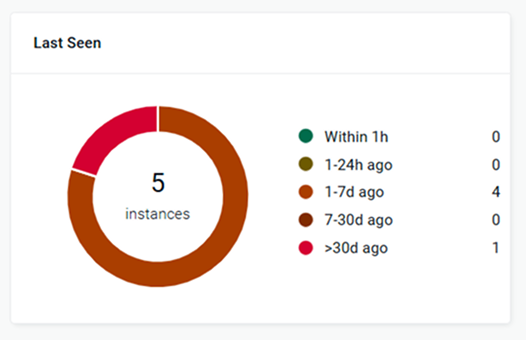 | When each instance last reported to My OPSWAT Central Management |
License Status 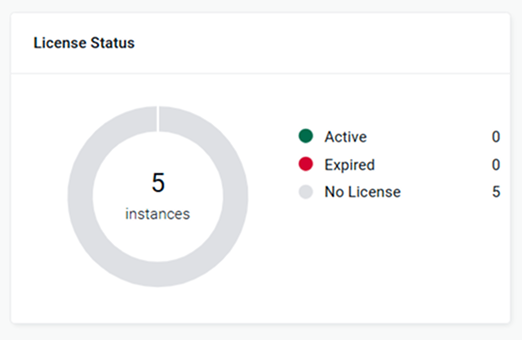 | Instances grouped by license state |
Detect and Investigate Threats
The activity widgets below the health row show what your MetaDefender ICAP Server instances inspected in the selected timeframe, how each request was handled, and why.
Quick jump to your specific focus:
Assess overall request activity
The Summary row gives you the headline numbers for the selected timeframe.

Widget | What It Shows |
|---|---|
ICAP Instance(s) | Number of MetaDefender ICAP Server instances that processed at least one request in the selected timeframe |
Total Processed Request(s) | Every request your instances inspected |
Total Blocked Request(s) | Requests that a policy prevented from reaching their destination |
Total Sanitized Request(s) | Requests whose content was rebuilt by Deep CDR into a safe version before delivery |
Understand why requests were allowed or blocked
Two widgets rank the reasons behind each verdict, so you can see which security layer is driving decisions and tune policy where it matters. Select View All on either widget for the complete list of reasons.
Widget | What It Shows |
|---|---|
Top Allowed Reasons 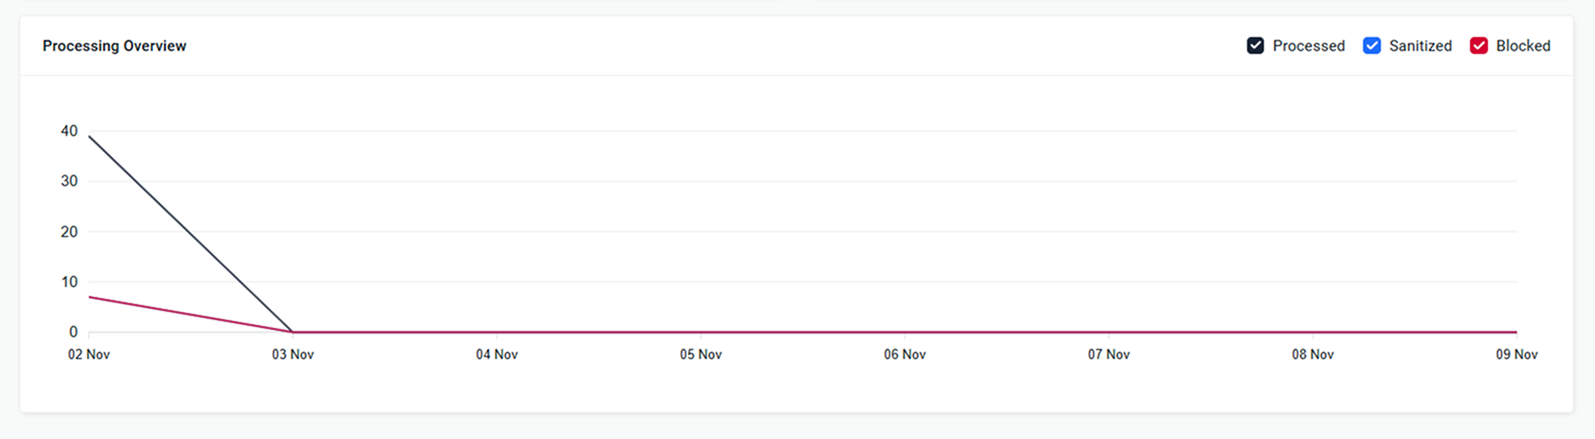 | Requests that reached their destination, ranked by reason |
Top Blocked Reasons 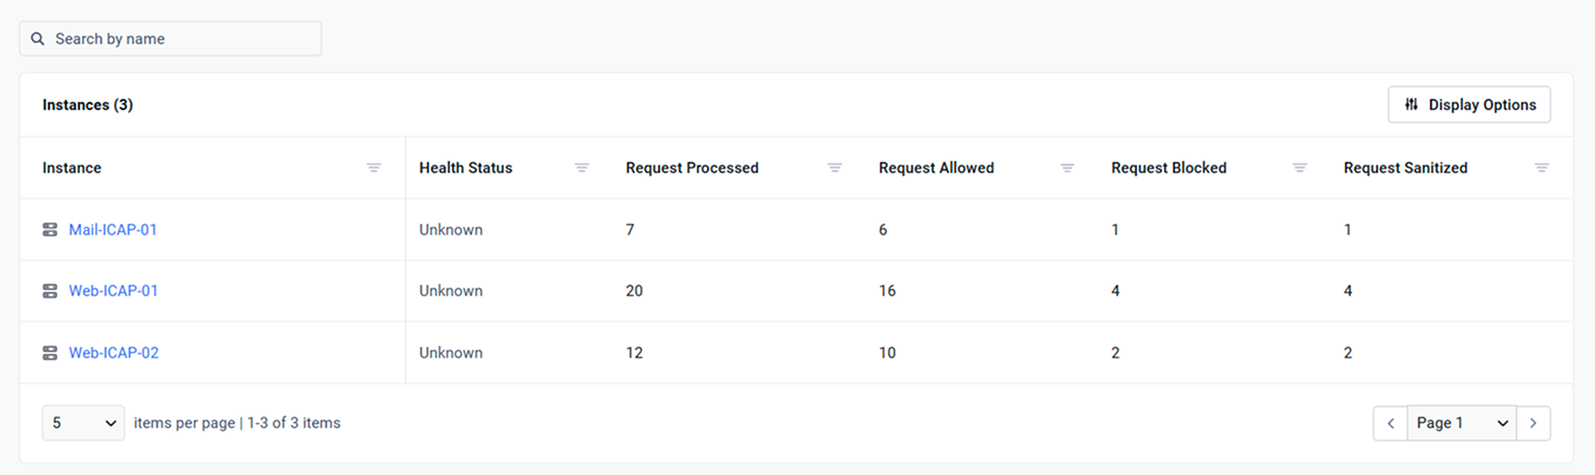 | Requests that were stopped, ranked by reason |
Track processing trends
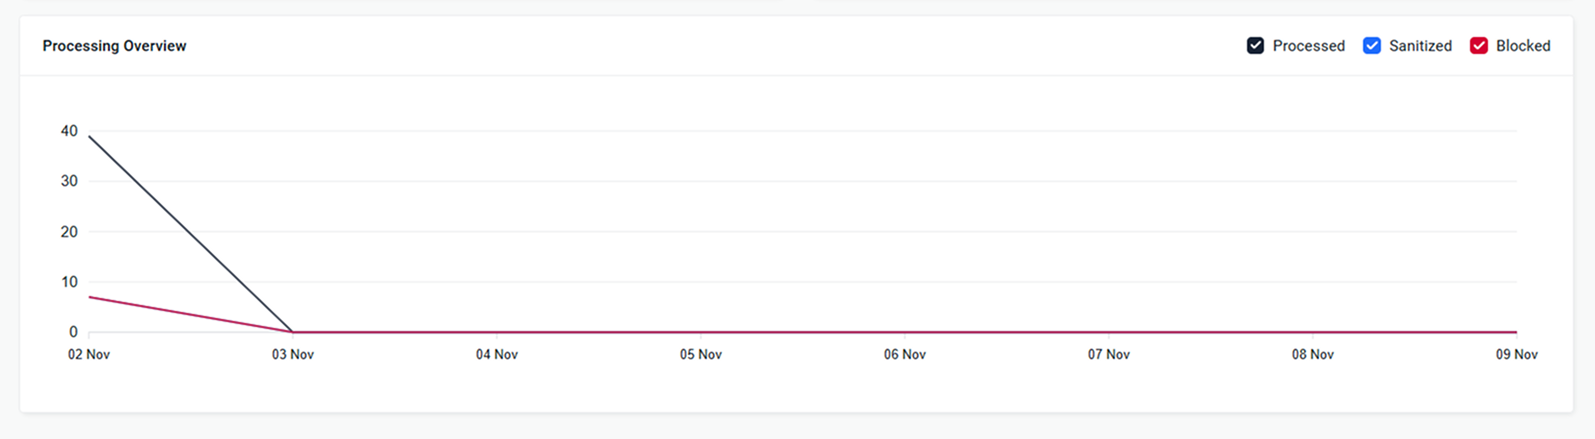
The Processing Overview chart plots daily Processed, Sanitized, and Blocked request counts across the selected timeframe. Use it to spot spikes, confirm instances are actively inspecting traffic, and correlate a block spike with a specific date.
Review Activity by Instance
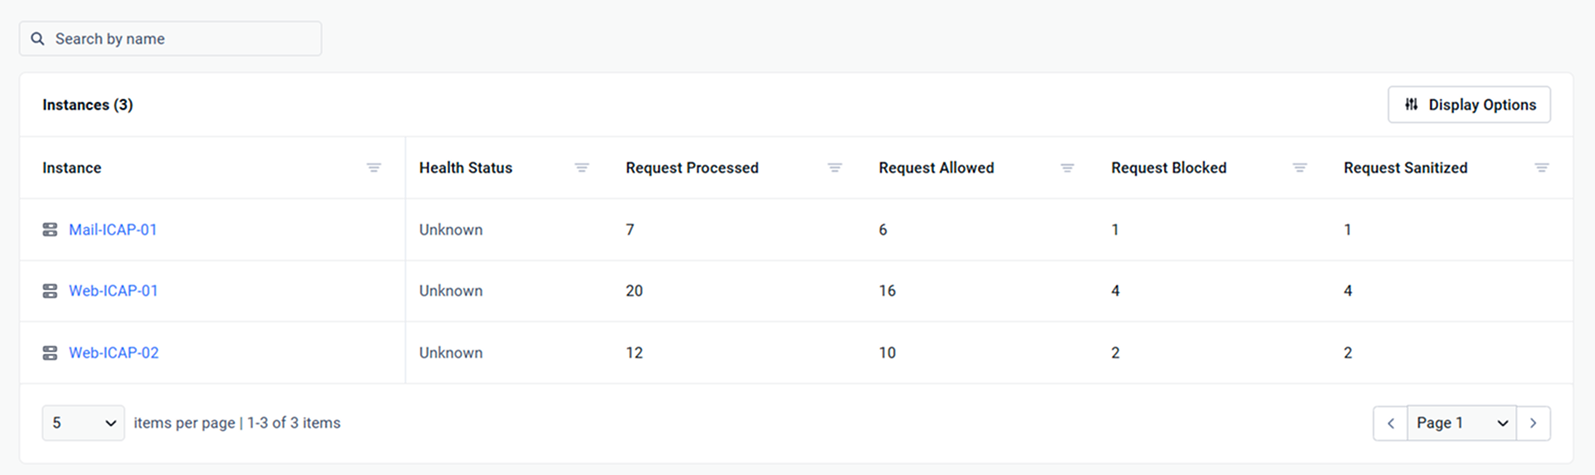
The Instances table at the bottom of the dashboard lists every MetaDefender ICAP Server instance that processed requests in the selected timeframe, with a per-instance breakdown of verdicts. Use it to find which instance is blocking the most traffic, or which one is reporting problems.
Column | What It Shows |
|---|---|
Instance | Instance name. Select the name to open the instance details page. |
Health Status | Current health reported by the instance (same categories as the Health Status widget) |
Request Processed | Requests inspected by this instance in the timeframe |
Request Allowed | Requests delivered to their destination, including sanitized ones |
Request Blocked | Requests stopped by policy |
Request Sanitized | Requests whose content was rebuilt by Deep CDR before delivery |
To work with the table:
Enter a name in Search by name to find a specific instance
Select a column header icon to sort by that column
Select Display Options to choose which columns to show
Use the items per page selector and page controls at the bottom to move through large deployments