
The MetaDefender Core dashboard gives you a centralized view of every file processed by your MetaDefender Core instances, and the health of the instances doing the processing.
Use dashboard widgets to see how much was blocked, which technology caught it, and confirm your instances are connected and licensed.
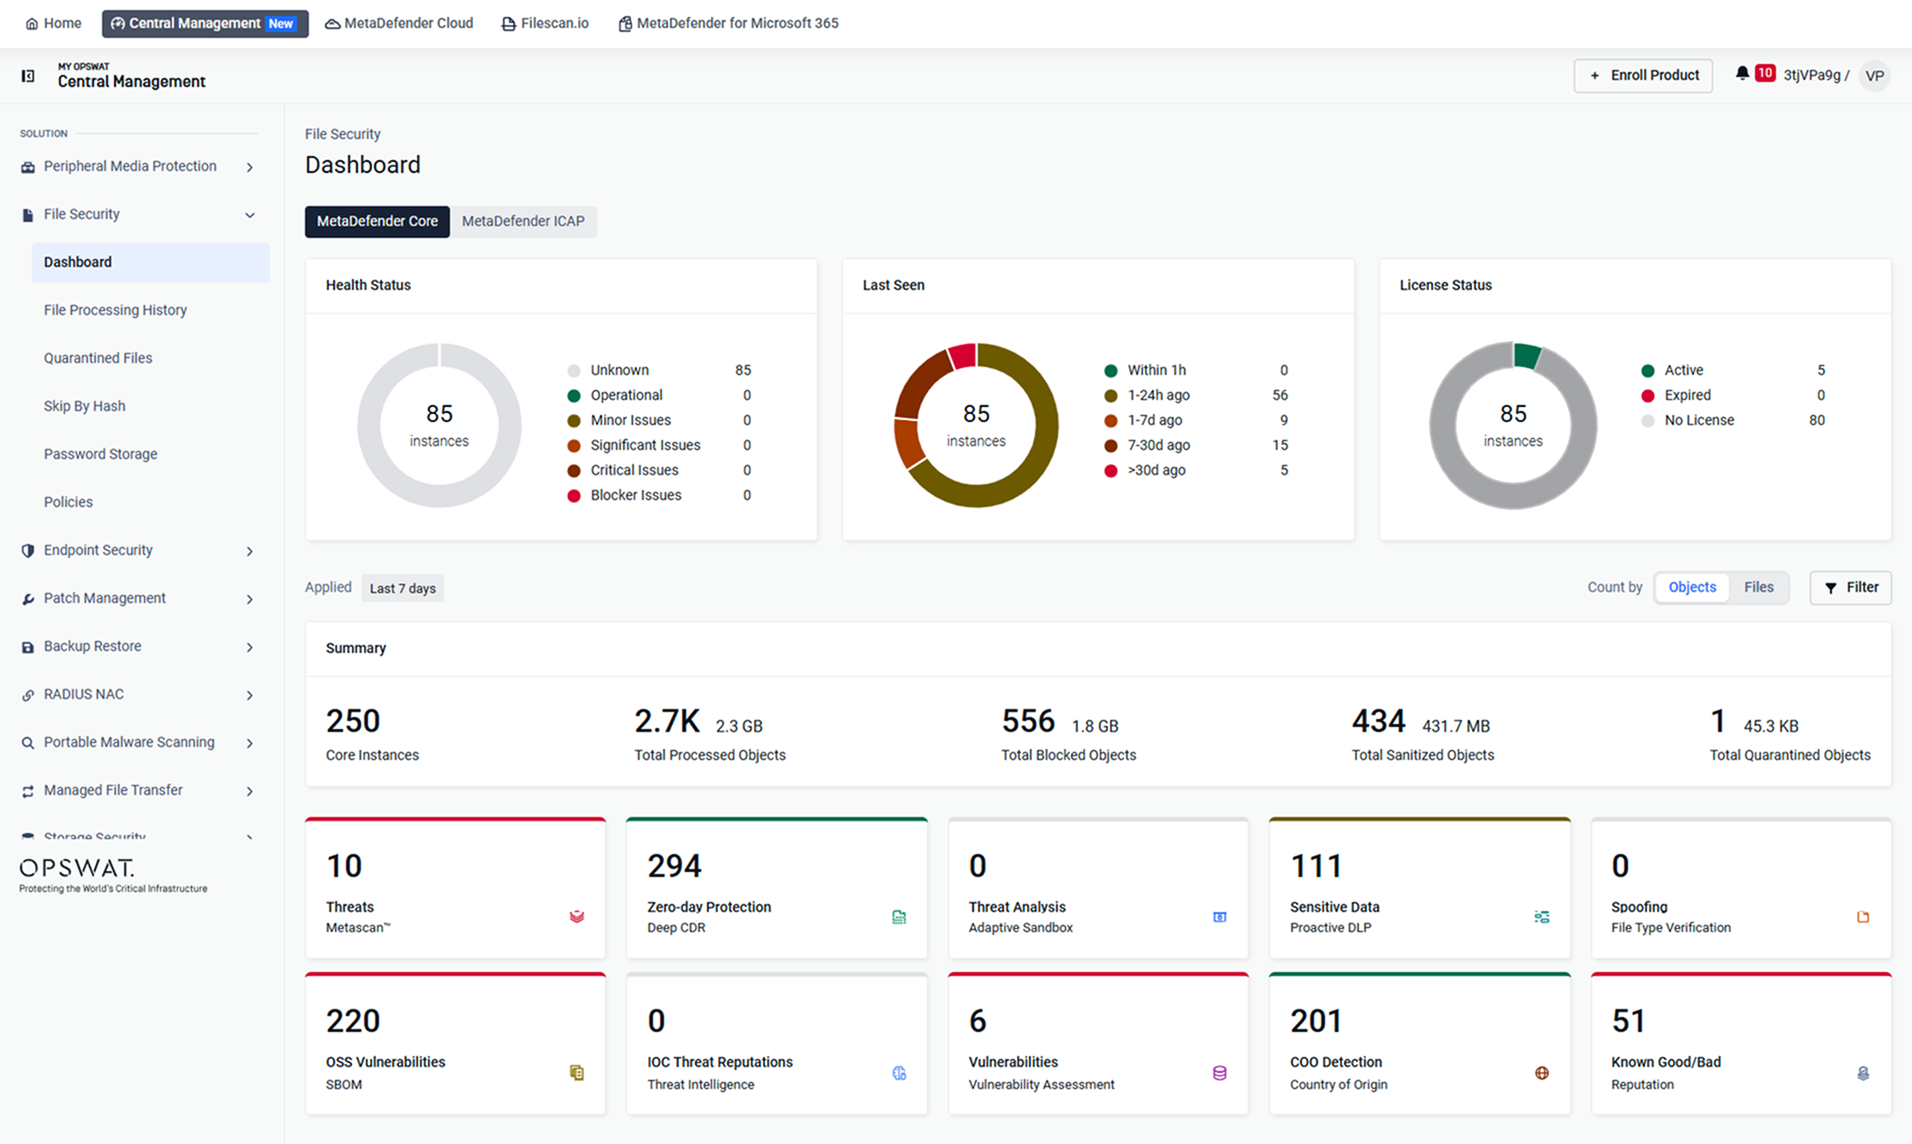
Open MetaDefender Core Dashboard
In the left navigation, select File Security > Dashboard
Select the MetaDefender Core tab
Use the controls above the Summary section to scope the activity widgets:

Control | What It Does |
|---|---|
Applied timeframe | Sets the reporting window for all activity widgets (default: Last 7 days). Widen the timeframe before concluding a widget is empty. |
Count by | Switches activity counts between Objects (every file and extracted sub-file, such as items inside an archive) and Files (top-level submissions only). |
Filter | Narrows the view to specific instances or groups. |
Monitor Product Instance Health
The three widgets at the top of the dashboard give a real-time overview of your enrolled MetaDefender Core instances. Each widget shows the total number of instances in its center; hover over a segment to see the count for that category.
Widget | What It Shows |
|---|---|
Health Status 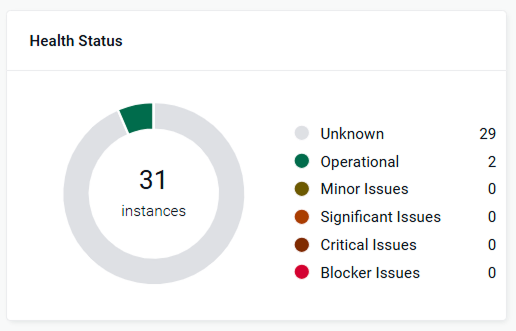 | Instances grouped by their reported health A large Unknown segment usually means instances have not reported recently |
Last Seen 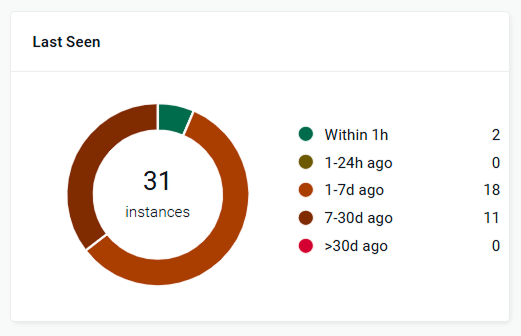 | When each instance last reported to My OPSWAT Central Management If instances appear in 7–30d ago, confirm the instance is running, or determine whether it has been retired |
License Status 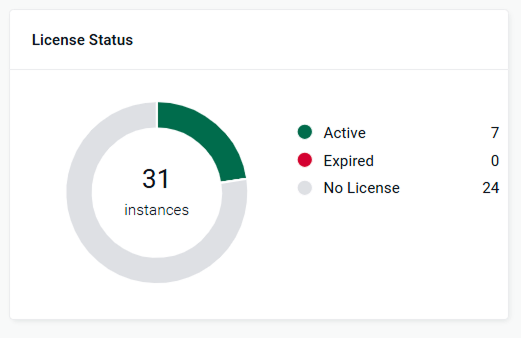 | Instances grouped by license state Expired instances stop processing files; No License instances have not been activated yet |
Detect and Investigate Threats
The activity widgets show what your MetaDefender Core instances processed in the selected timeframe, what was blocked, and which technology caught it.
Quick jump to your specific focus:
Assess overall processing activity
The Summary row gives you the headline numbers for the selected timeframe. Each count also shows the total data volume processed.

Widget | What It Shows |
|---|---|
Core Instances | Number of MetaDefender Core instances that processed at least one file in the selected timeframe |
Total Processed Objects | Everything your instances scanned, with total size |
Total Blocked Objects | Objects that a policy prevented from reaching their destination, with total size |
Total Sanitized Objects | Objects that Deep CDR rebuilt into a safe version before delivery |
Total Quarantined Objects | Objects moved to quarantine for review. See Quarantined Files |
Identify which technology is catching threats
Ten technology cards break down detections by the MetaDefender technology that flagged them, so you can see which layer is driving the most interventions and tune policy where it matters.
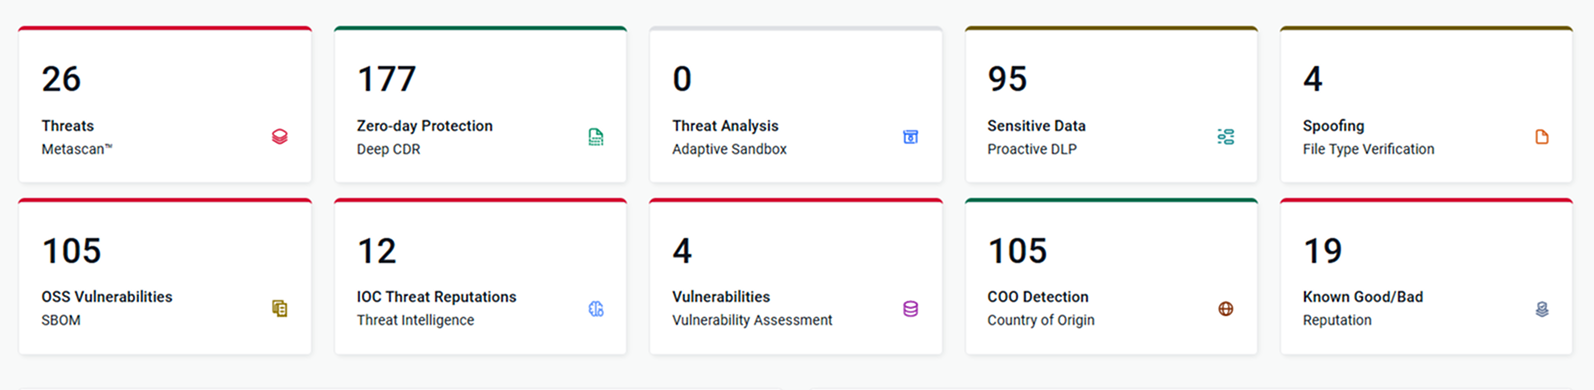
Card | Technology | What It Shows |
|---|---|---|
Threats | Metascan™ (Multiscanning) | Files identified as malware by one or more anti-malware engines |
Zero-day Protection | Deep CDR | Files sanitized to remove potentially malicious embedded content before delivery |
Threat Analysis | Adaptive Sandbox | Files flagged as malicious after dynamic analysis |
Sensitive Data | Proactive DLP | Files containing sensitive data (such as credit card or social security numbers) that triggered a DLP rule |
Spoofing | File Type Verification | Files whose actual type does not match their extension or declared type |
OSS Vulnerabilities | SBOM | Open-source software components with known vulnerabilities found inside files such as containers or packages |
IOC Threat Reputations | Threat Intelligence | Files matching known indicators of compromise from OPSWAT threat intelligence |
Vulnerabilities | Vulnerability Assessment | Installers and binaries with known application vulnerabilities (CVEs) |
COO Detection | Country of Origin | Files whose origin matches a country restricted by your policy |
Known Good/Bad | Reputation | Files matched against a known-good or known-bad hash reputation database |
Track processing and blocking trends
Two line charts show daily activity across the selected timeframe. Use them to spot spikes, confirm instances are actively processing, and correlate a block spike with a specific date.
Widget | What It Shows |
|---|---|
File Submission 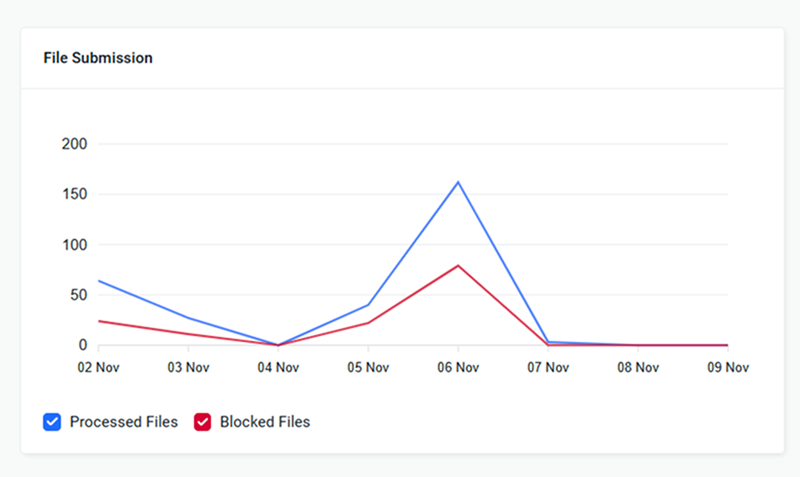 | Daily count of Processed Files and Blocked Files |
Object Processing 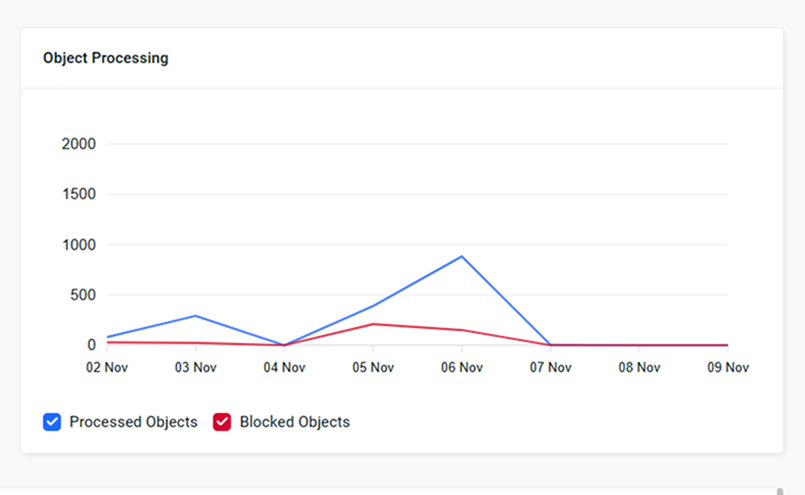 | Daily count of Processed Objects and Blocked Objects Object counts run higher than file counts because archives and documents are unpacked. |
Review Activity by Instance
The Instances table lists every MetaDefender Core instance that processed files in the selected timeframe, with a per-instance breakdown of the same detections shown on the technology cards.
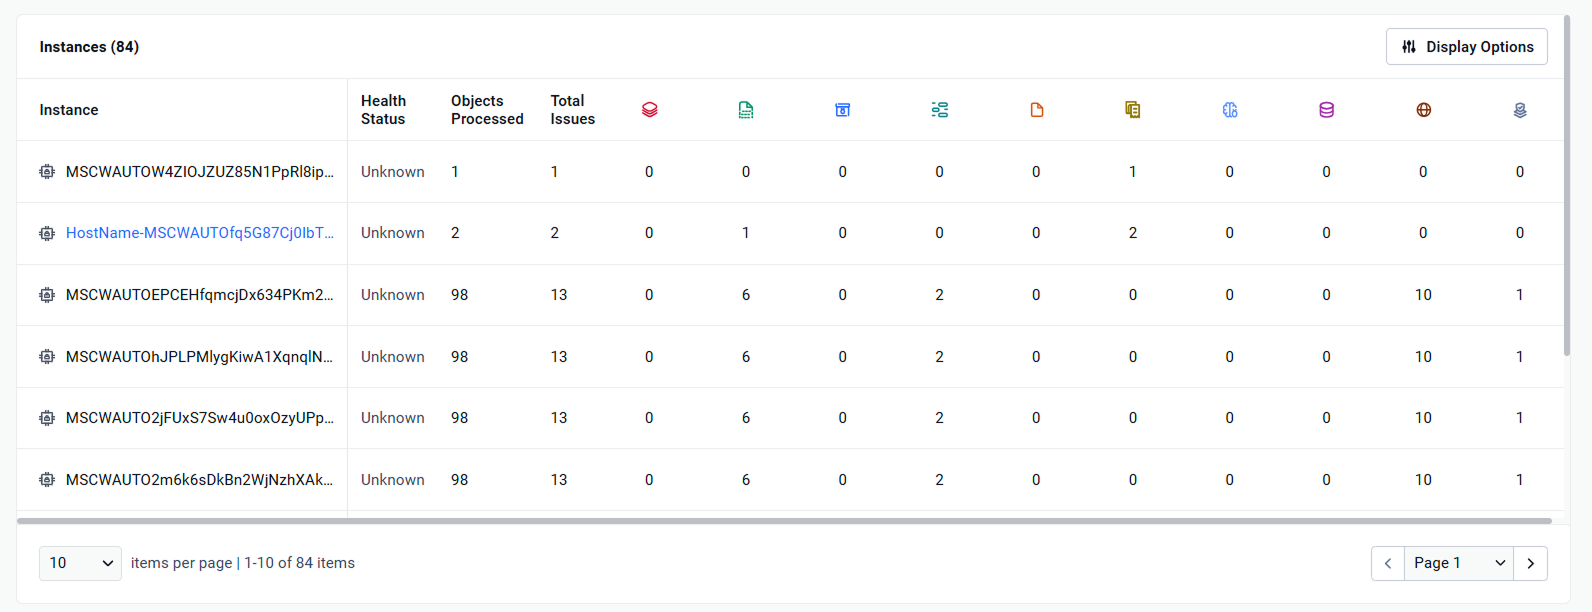
Column | What It Shows |
|---|---|
Instance | Instance name. Select the name to open the instance details page |
Health Status | Current health reported by the instance |
Objects Processed | Objects scanned by this instance in the timeframe |
Total Issues | Objects with at least one detection on this instance |
Technology columns | One column per technology card. Hover over a column icon to see its name |
To work with the table:
Select Display Options to choose which columns to show
Scroll horizontally to see all technology columns
Use the items per page selector and page controls at the bottom to move through large deployments
Act on What You Find
If you see | Go to |
|---|---|
A blocked or sanitized file you want to trace | |
Quarantined objects to release or delete | |
A known-safe file repeatedly blocked | |
A technology card that should be higher or lower | |
Instances with Expired or No License | |
Instances not reporting | Inventory to check connection details |