The Dashboards give administrators a quick, consolidated view of key system metrics (System Dashboard) and file security activity (File Security Dashboard) through several built-in widgets. These widgets can be customized — see Editing the Dashboard below.
There are two widget types:
- Time-based widgets – display metrics for a selected time period.
- Current-state widgets – show real-time system information such as storage usage, user counts, or license status.
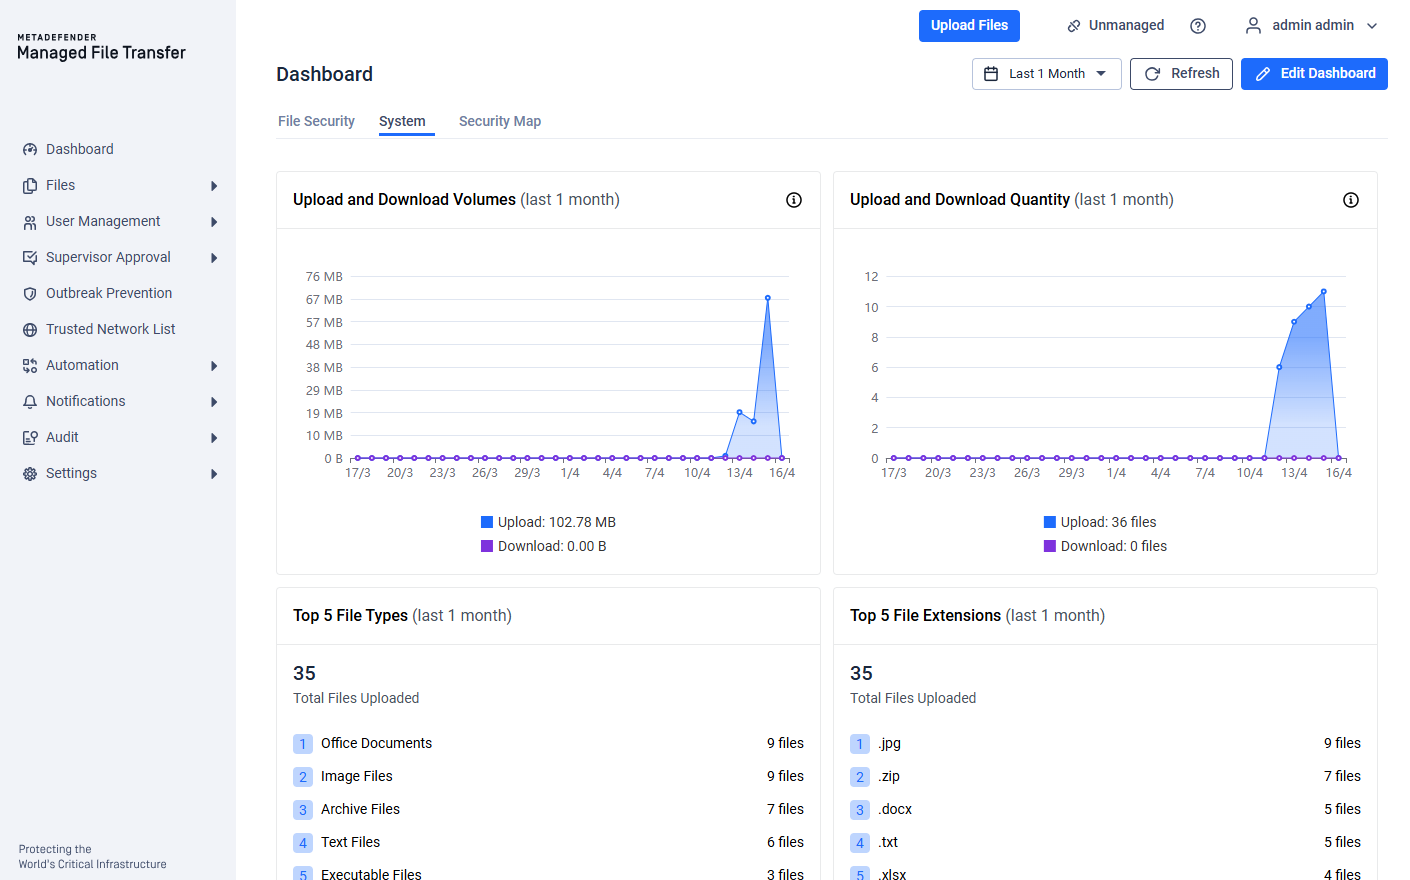
Time Interval Selector
A time interval selector at the top of the Dashboards lets you adjust the reporting period for all time-based widgets. You can choose from:
- Last 24 hours
- Last 1 month
- Last 26 weeks
- Last 1 year
These intervals do not apply to the current-state monitoring widgets.
Editing the Dashboard
Both the System and the File Security Dashboard support layout customization. Click the 'Edit Dashboard' button in the toolbar to enter edit mode. The Security Map Dashboard does not support editing.
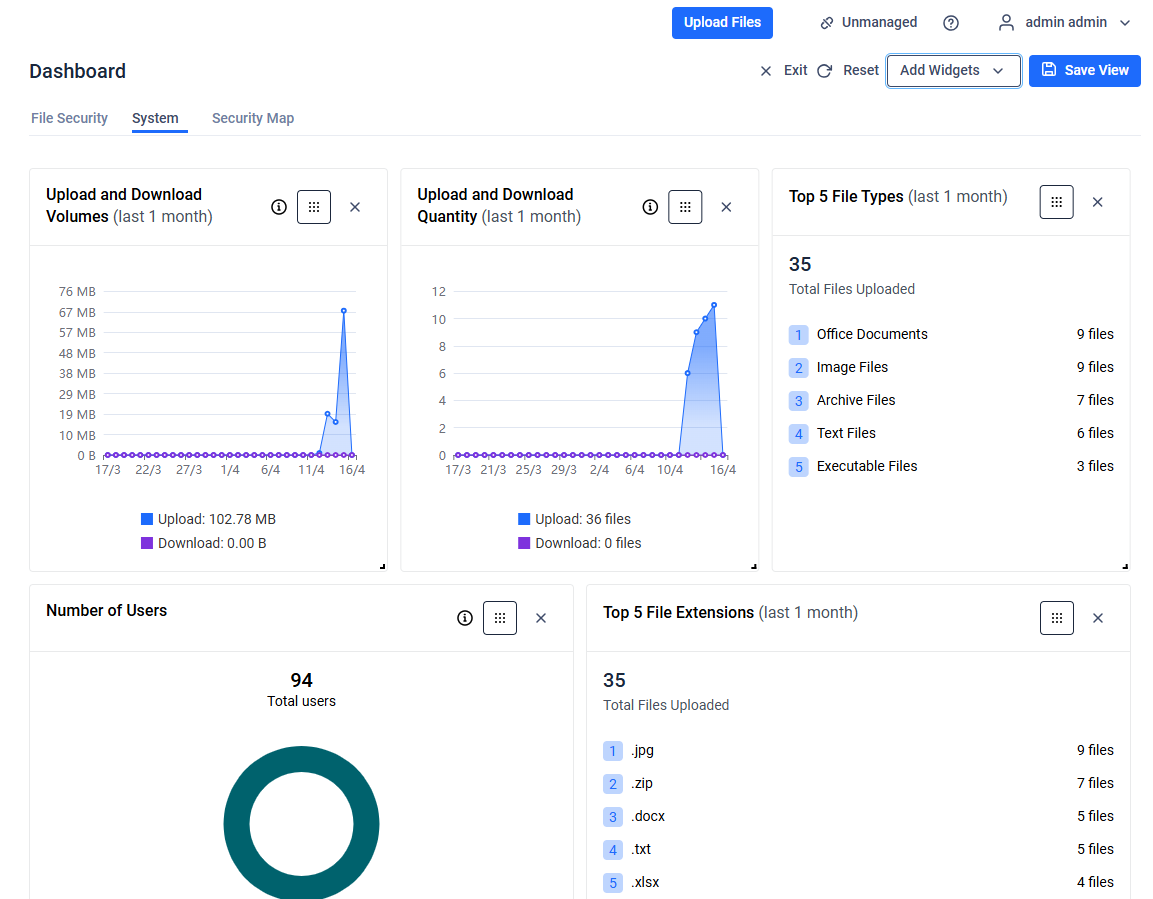
In edit mode you can:
Add or remove widgets – use the widget chooser to show hidden individual widgets, or click on the 'X' button on the widget to hide it
Drag widgets – reorder widgets by dragging them to a new position
Resize widgets – adjust the width and height of supported widgets
Reset – restore the dashboard to its default widget configuration
Save View – persist your customized layout, or click 'Exit' to discard changes
Dashboard layouts are saved per user.
Widget Constraints
Not all widgets can be freely rearranged. The following widgets have a fixed position and size and cannot be dragged, resized, or removed:
Processing Summary
Threats Prevented
Data Loss Prevented
File Sanitization
Security Summary
Database Storage
The File Storage widget can be dragged and removed but cannot be resized.
All other widgets (File Activity Volumes, File Activity Quantity, User Count, License Status, Security Trend, File Types, File Extensions, Threat Prevention Verdicts, Vulnerabilities, Malware Detection Engines, Blocked Origins, Failed Login Attempts, Users with Failed Login Attempts, Top Users Failed Login) can be freely dragged, resized, and removed.