MetaDefender Core provides a Web-based user interface (default port is 8008) that gives a general overview of MetaDefender Core status and allows you to configure its options.
Note that the default auto refresh rate of displayed information is 30 seconds.
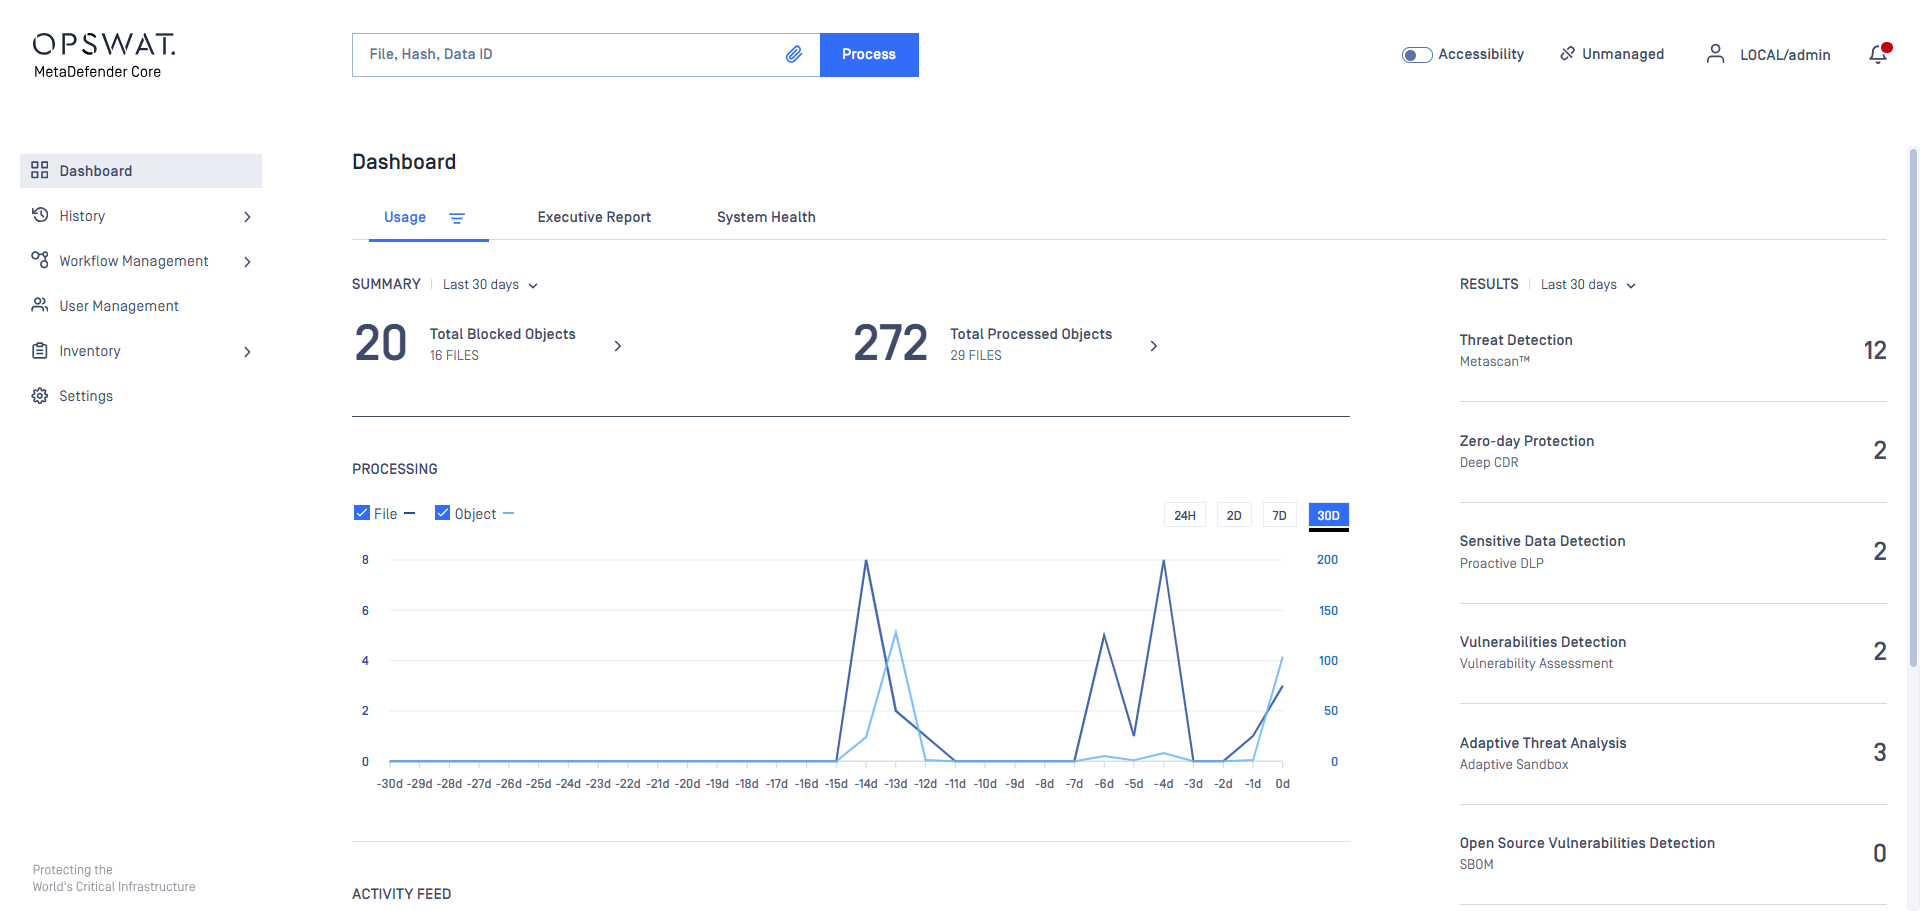
Overview page
The Overview page shows information on
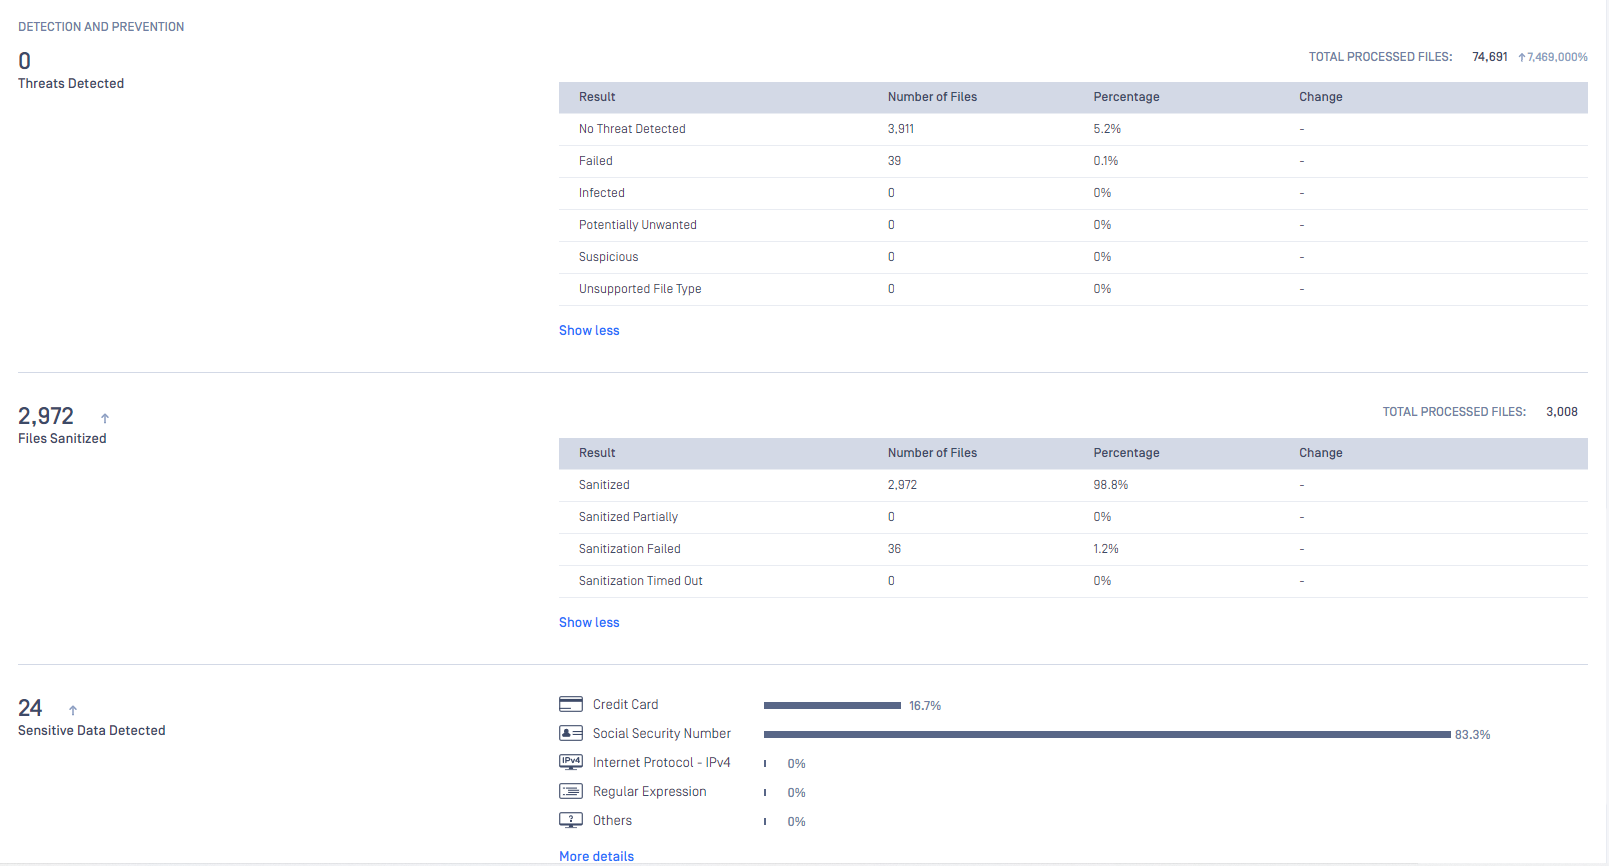
- Number of threats detected
- Number of files blocked
- Number of files sanitized
- Number of detected files having vulnerabilities
- Total number of files processed
- Number of threats analyzed by Adaptive Sandbox
- Number of countries of origin detected
- Number of scanned objects in the last 30 days
- Statistics on number of processed files in time (line chart)
- Statistics on processing results (two doughnut charts)
- Statistics on number and types of sensitive data detected (bar chart)
- Statistics on vulnerability severities (bar chart)
Both the default refresh rate (default is 1 minute) and the span of time displayed (24 hourss) can be changed.
Executive Report
The executives report page is to provide all needed statistics processed data.
The span of time displayed (24 hourss) can be changed.
Overview
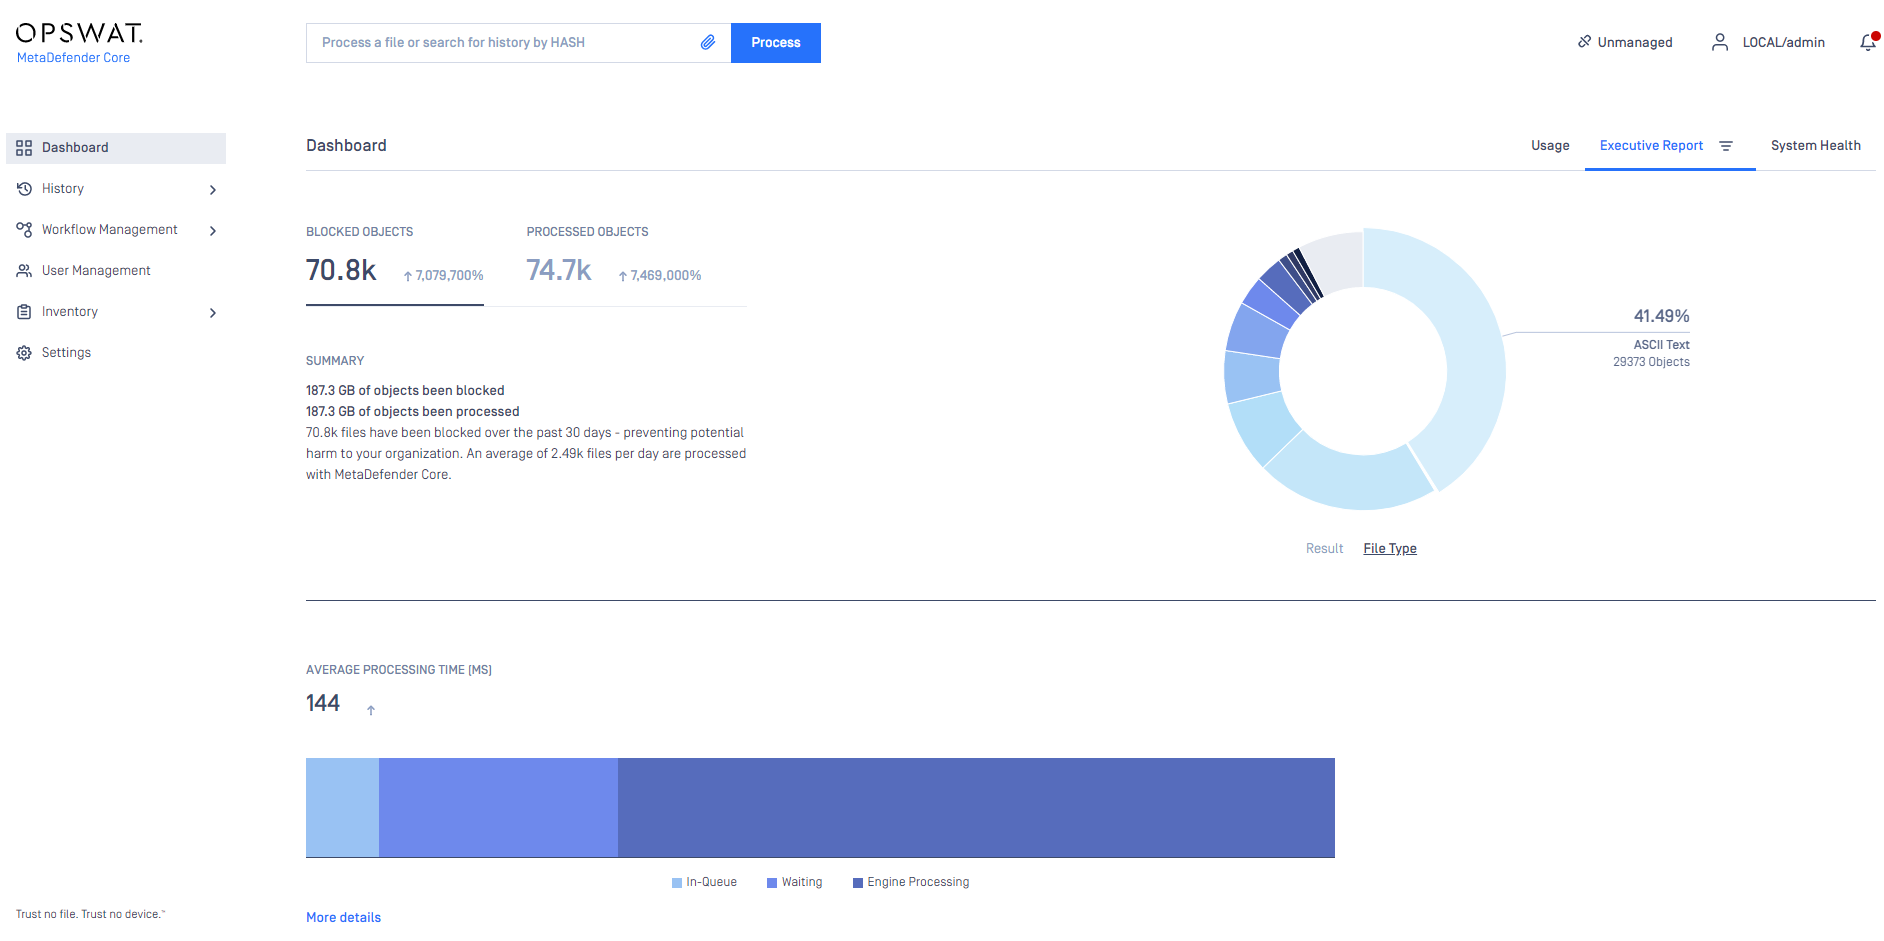
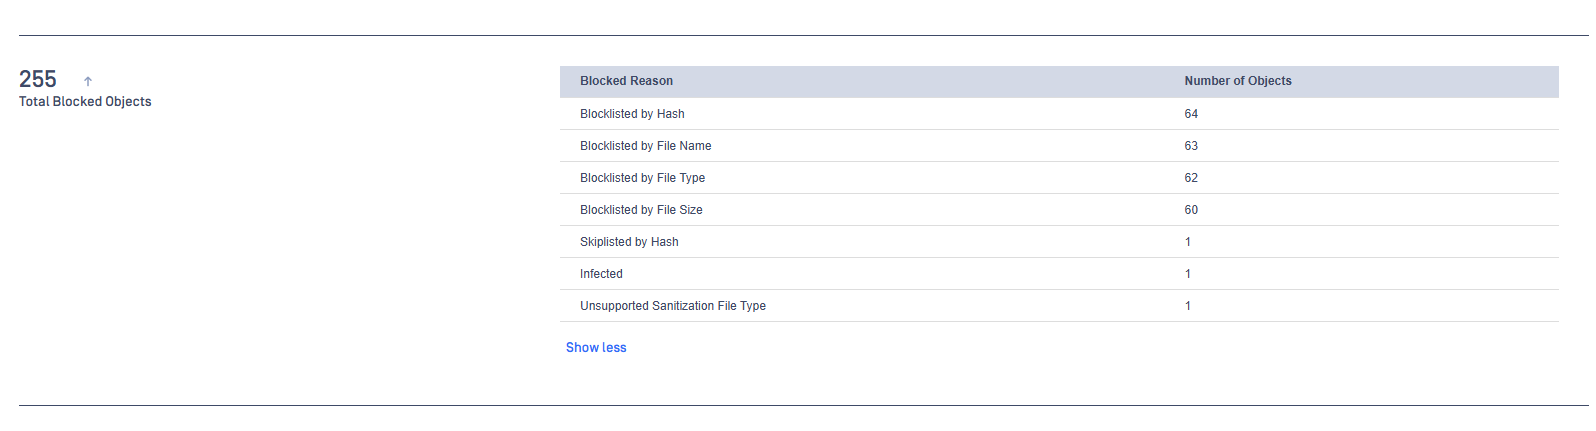
Statistics by block reason
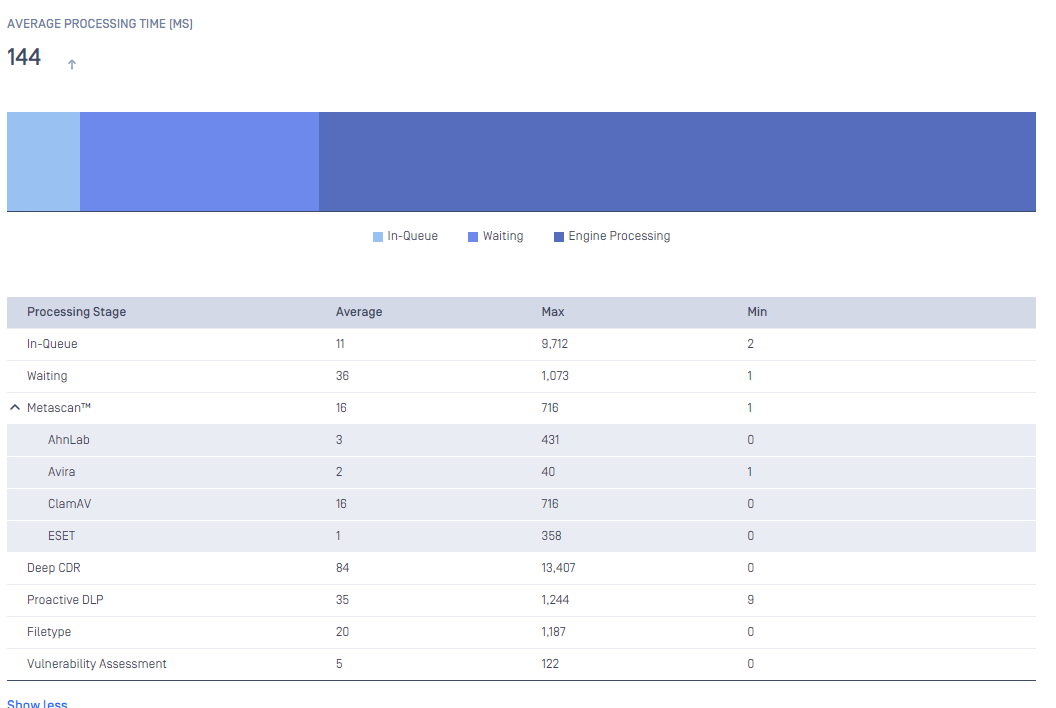
Statistics for processing time
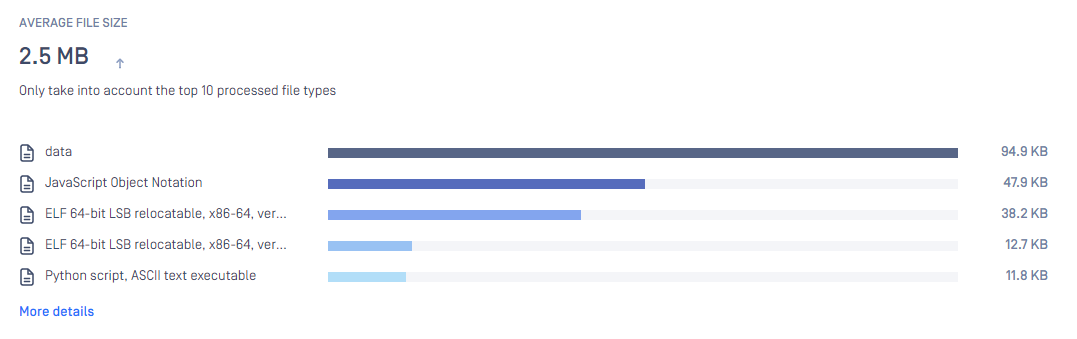
Statistics for file size
You can also export the executive report to PDF file for sharing:
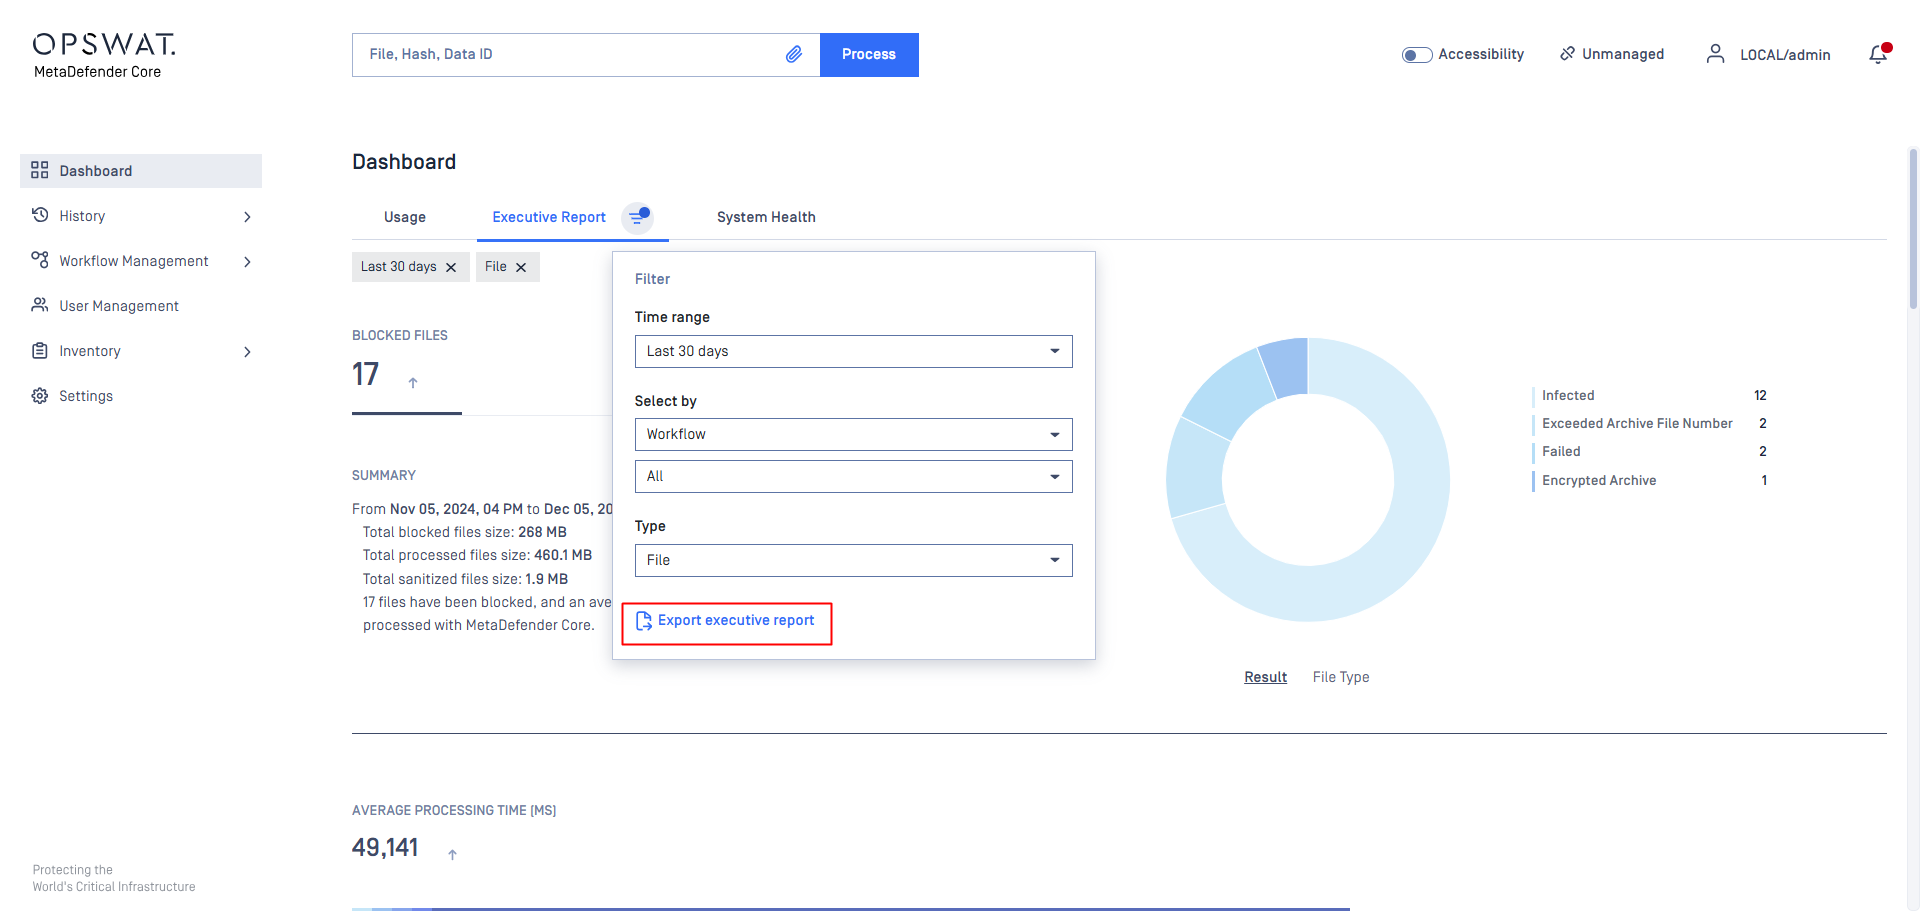
Product offers options where users can search by Workflow/Source/User and filter by File/Object:

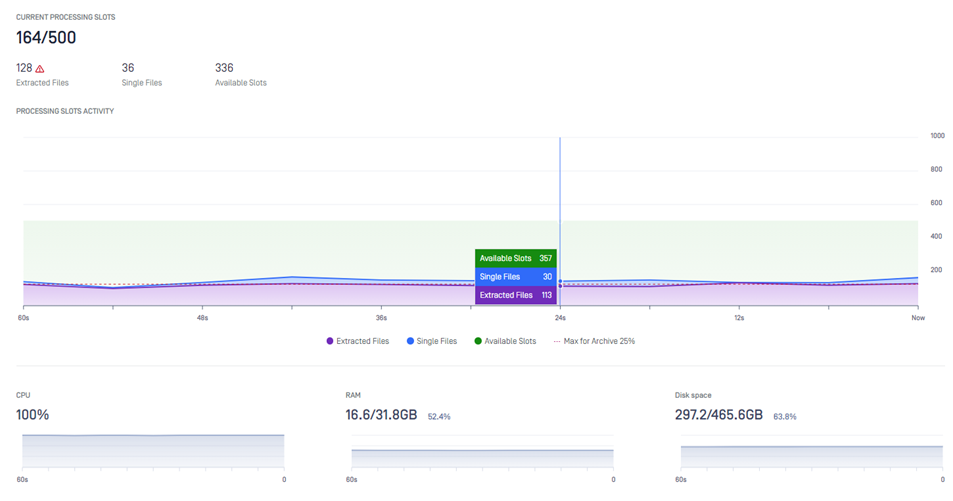
System Health
The system health page is to provide the current system resource status (CPU, memory and disk) and processing performance (scan queue) of MetaDefender Core server.
##
Quarantine
The Quarantine page shows all scanned files which are copied to the quarantine. Each of them can be pinned to avoid removal on cleaning up. Also comments can be written to each quarantined file. Quarantine log can be searched for comment, file name and source of the scan request.
Update history
The Update history shows information on every update package related event.
On the Update history page you can also search for engine name, package type or message content. Also you can filter the list for severity.
Configuration history
The Configuration history shows information on user activity events regarding workflow rule changes, setting changes, engine setting changes, licensing.
You can search for text on the Configuration history page and filter the list for datetime.