
Overview
The File Processing Time chart on the MetaDefender Core dashboard (Dashboard → System tab) shows how long each processing engine takes to handle files over the selected time period. Use it to compare engines, spot slow ones, and follow processing-time trends across your deployment.
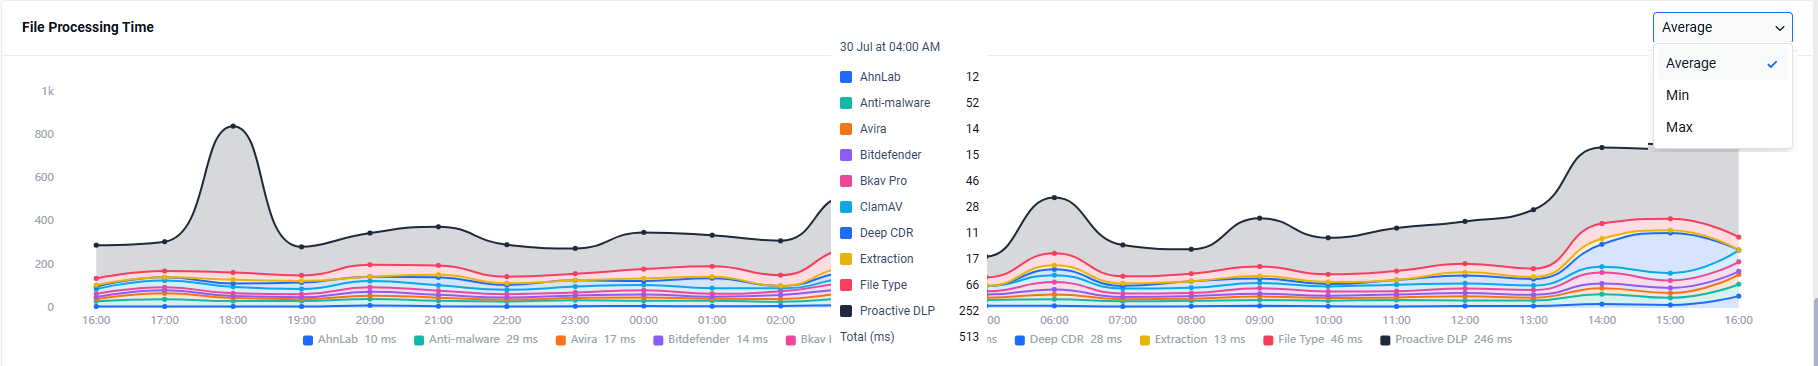
Chart elements
Element | Explanations |
|---|---|
Metric selector | Drop-down at the top-right of the chart. Choose which value to plot: Average, Min, or Max processing time. |
Engine series | One coloured line (with a shaded area) per processing engine — for example the av engines (AhnLab, Avira, ClamAV, …), Deep CDR, Proactive DLP, File Type, and Extraction. Each line is that engine's processing time over time. |
Legend | Below the chart. Lists every engine shown, its colour, and its value for the selected period. |
Vertical axis | Processing time, in milliseconds (ms). |
Horizontal axis | Time. Points are grouped by hour, day, or month to match the dashboard time range you select. |
Tooltip | Hover over any point to see each engine's processing time at that moment. |
Metric Values
Definition | Explanations |
|---|---|
Average | The arithmetic mean of processing times for all files during the reporting period. |
Max | The longest time any single file spent in a particular processing stage during the reporting period. |
Min | The shortest time any file spent in a particular processing stage during the reporting period. |
How to calculate
Average = Total processing time ÷ Number of files processed
Example — an engine processes three files with processing times of 5 ms, 10 ms, and 12 ms:
Average = (5 + 10 + 12) / 3 = 9 ms
Max = 12 ms
Min = 5 ms