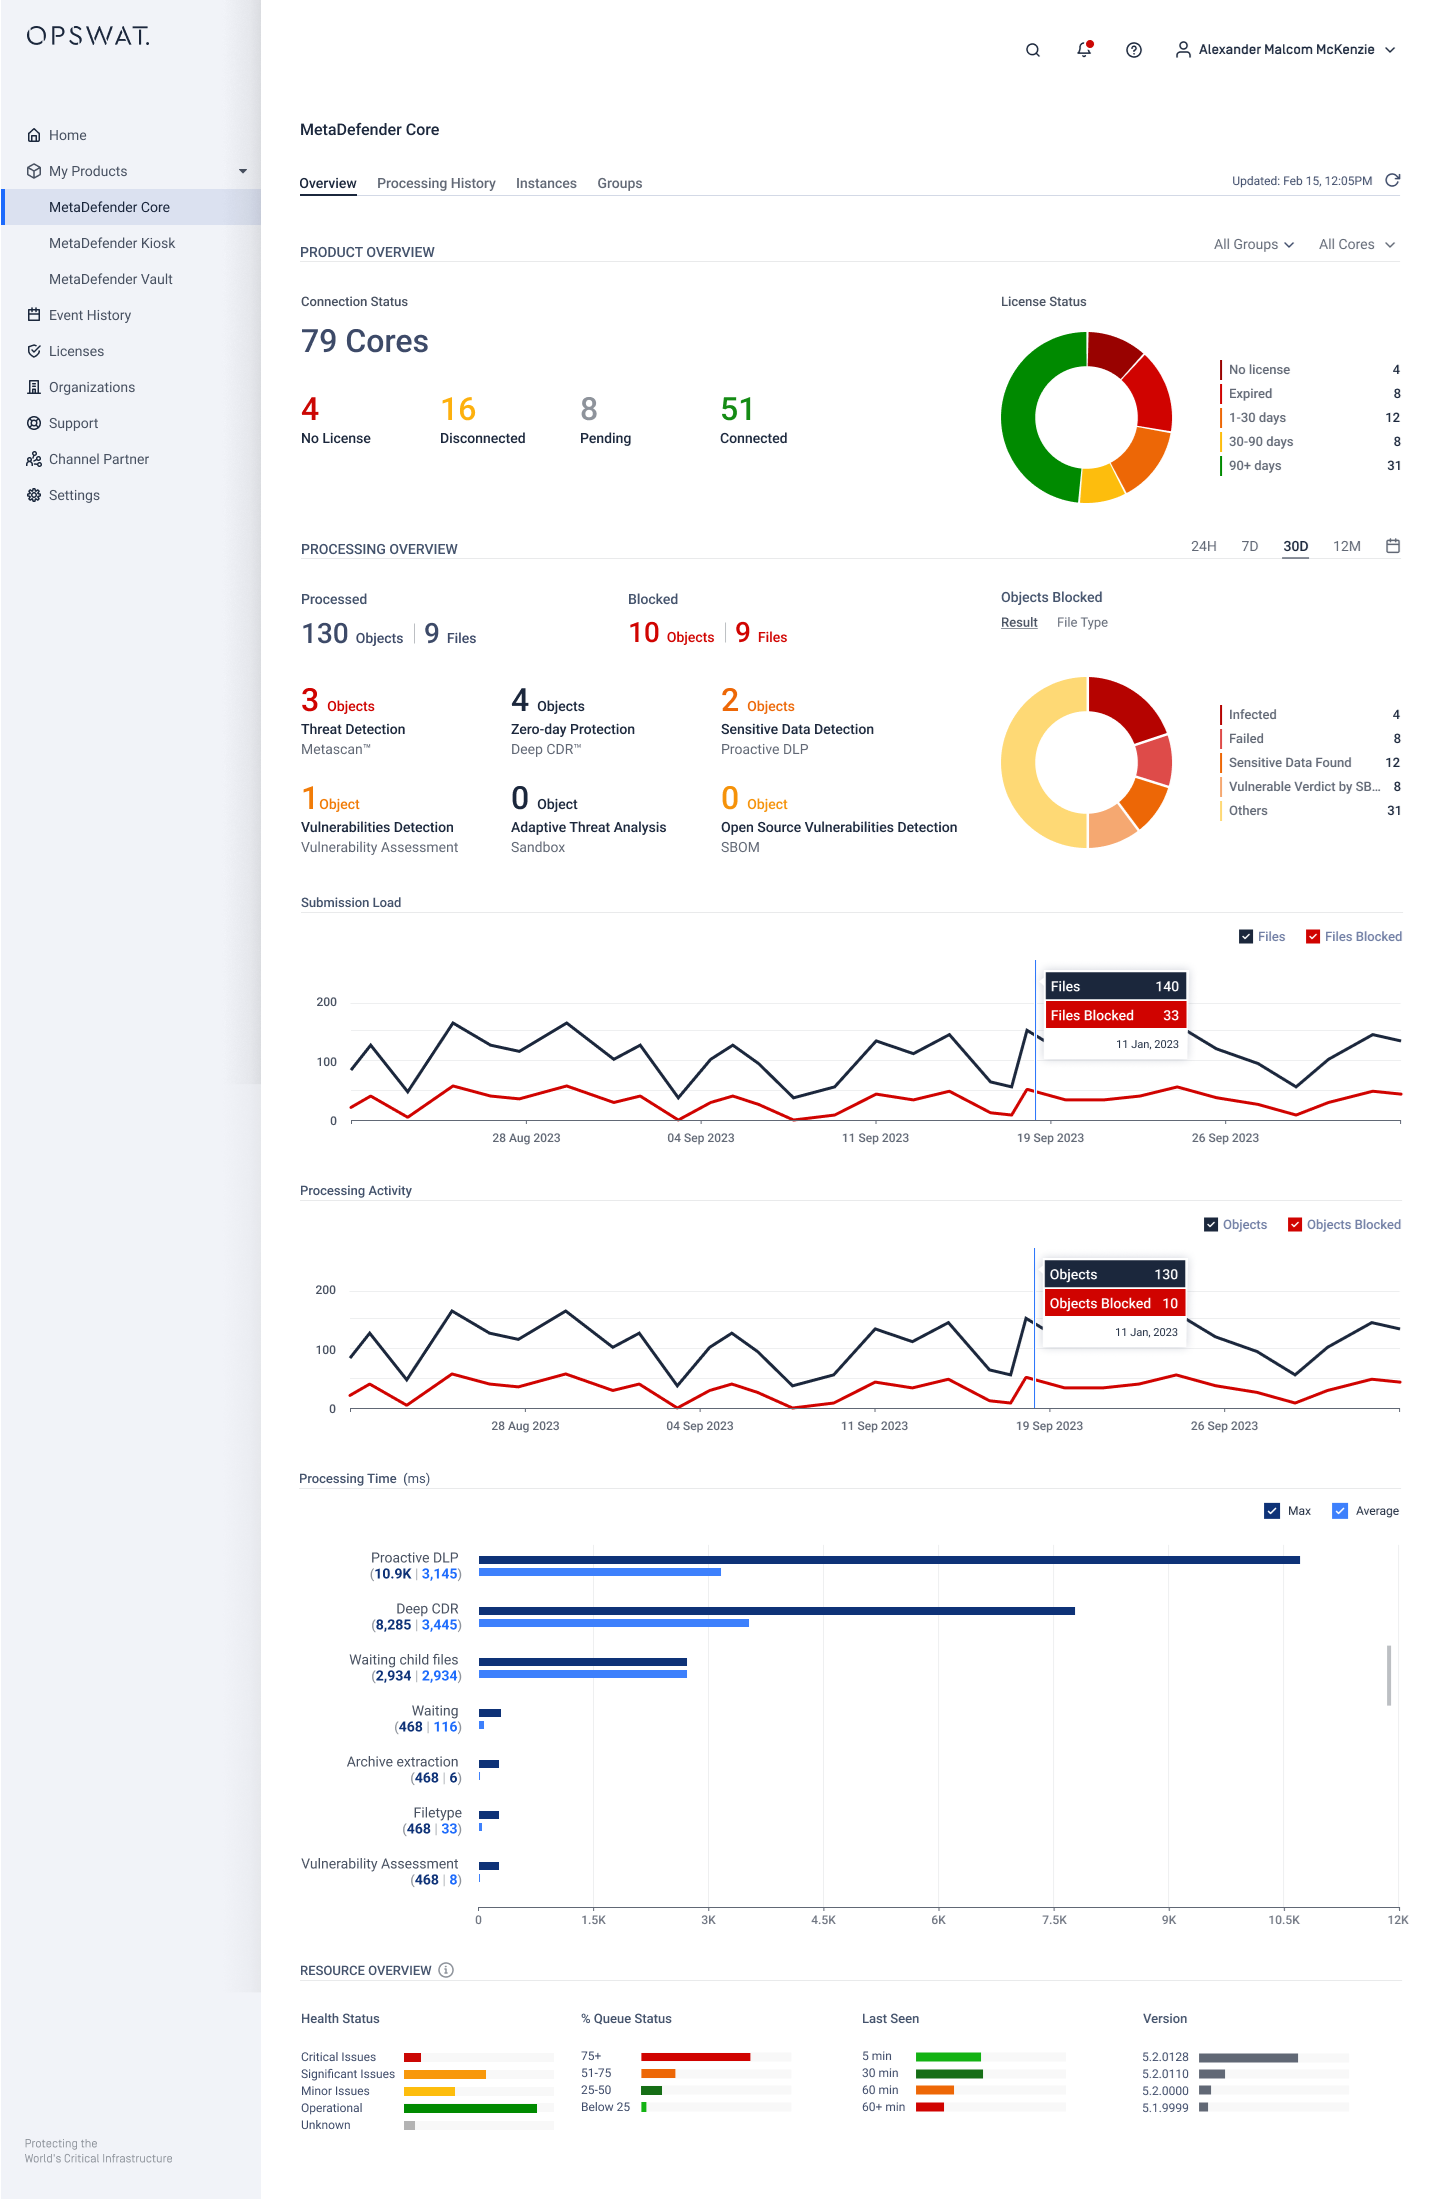
The MetaDefender Core Dashboard helps visualize, track and analyze data collected from the managed MetaDefender Core instances. The dashboard can be accessed from the left navigation menu, in Inventory > MetaDefender Core > Overview tab.
By default, the dashboard shows data collected for all managed instances over 24 hours. The period of time can be customized in the top left corner of the page. You can also apply filters to the dashboard to show only certain instances or instance groups.
Product Overview
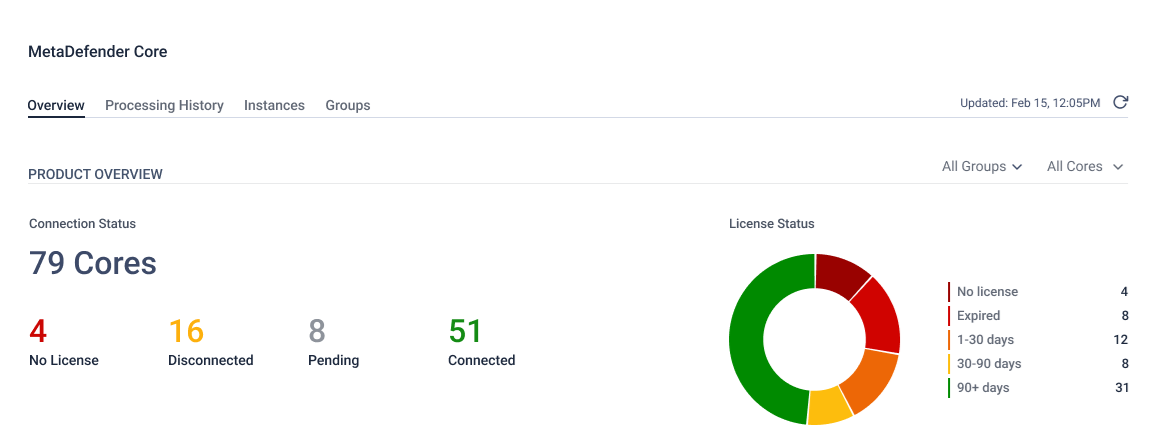
The Product Overview section displays a summary of managed MetaDefender Core instances/groups, which includes:
- The total number of instances and their current status.
- The instances' licensing status based on the remaining duration.
Processing Overview
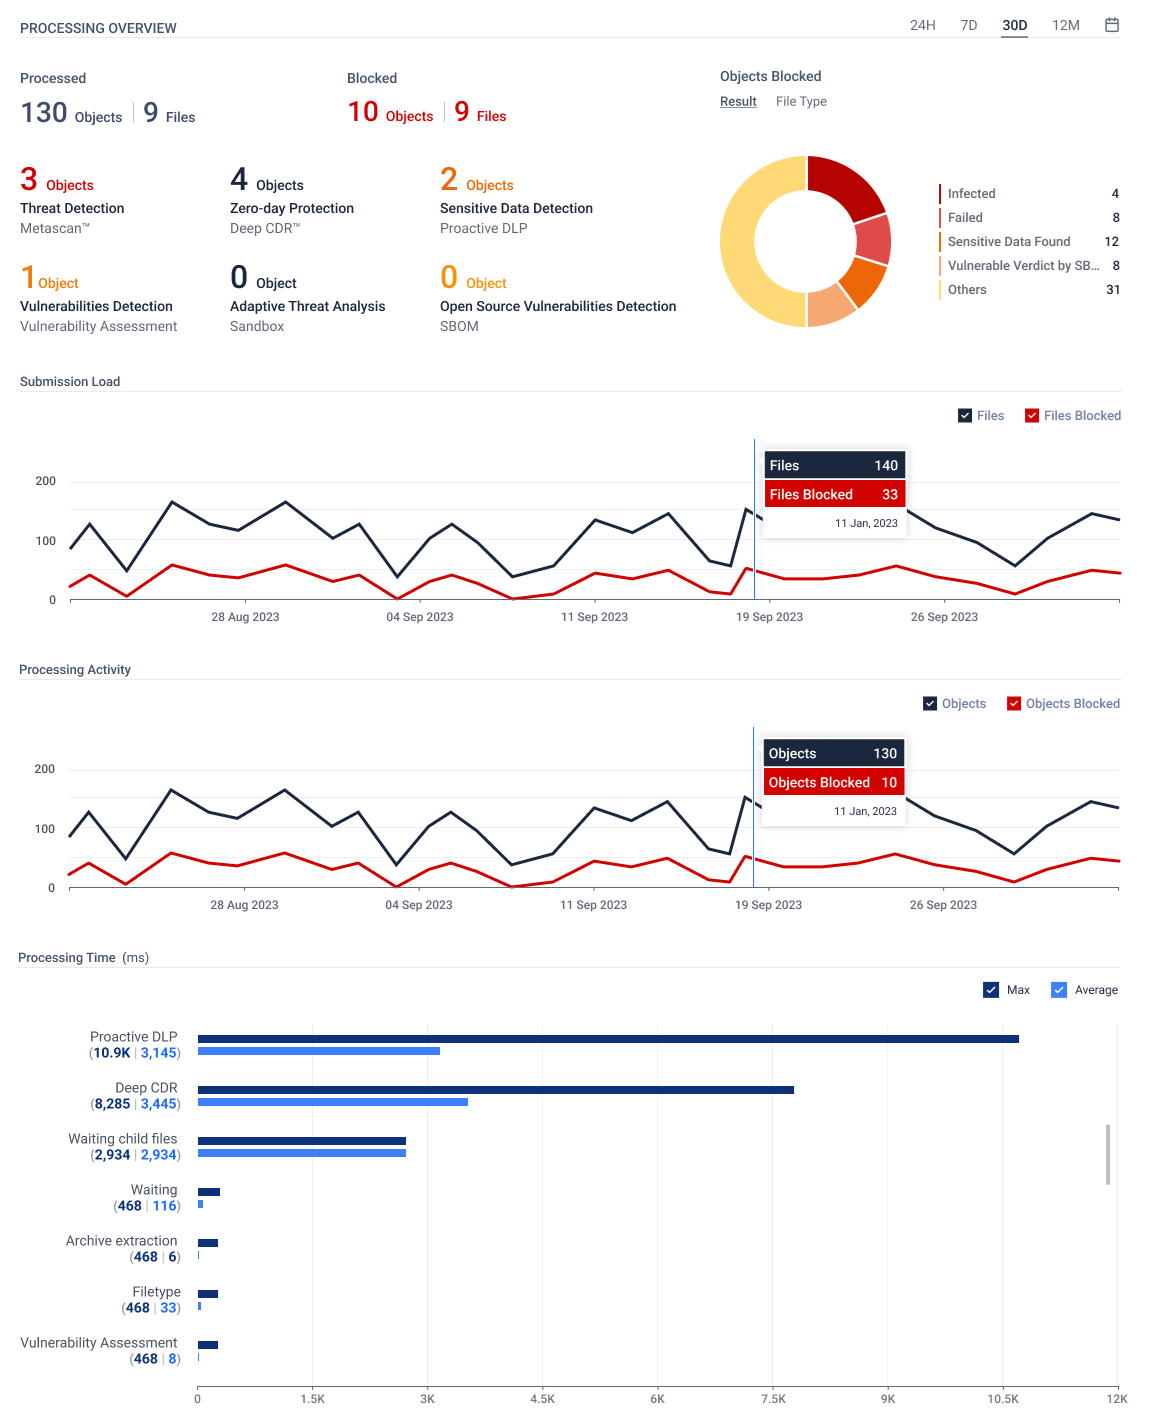
The Processing Overview tab displays a summary of the scan results collected from selected MetaDefender Core instances/groups over a specific time period, which includes:
- The number of objects scanned and average time it took to process.
- The top 5 ranking by module types.
- The health status of core instances: queue status, last seen, version.
- The results of object scans and which module was used to scan.
Resource Overview
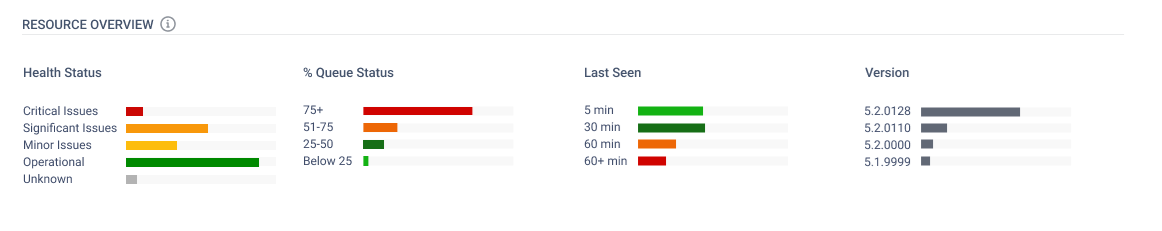
The Resource Overview section displays the breakdown of selected MetaDefender Core instances/groups excluding instances that are not licensed or disconnected, by the following criteria:
- Health status.
- Last seen time.
- Version
- Free storage space.