
MetaDefender Storage Security (MDSS) continuously monitors its own workload and automatically adjusts how much data it processes at once, so scans keep moving during busy periods and resources are freed up when activity is low. This happens on its own, with no manual setup.
This page explains what automatic scaling does, what you can see on the built-in System dashboard, the recommendations it may show you, and how to turn it off if you need to.
Overview
The amount of work flowing through MDSS rises and falls throughout the day as files are discovered, scanned, and remediated. Automatic scaling (the "autoscaler") keeps performance steady across those changes.
Its goal is to complete your files as fast as possible while keeping the system stable, by using the resources available to it as fully and efficiently as it can. Instead of running at a fixed pace, MDSS watches how busy the system is and adjusts how much work it processes in parallel. When there is work to do and capacity to spare, it raises throughput to get the most out of your hardware. When a resource approaches its limit, it settles at the highest rate that resource can sustain. When the backlog is cleared, it releases the resources it no longer needs.
Automatic scaling makes the resources you already have work as efficiently as possible. It does not add or remove servers on its own. When it detects that more capacity is needed, it tells you what to add through on-screen recommendations.
Automatic scaling is enabled by default and works out of the box. No setup is required.
How it works
Automatic scaling checks the system every few seconds and adjusts how much work MDSS takes on, so the available resources are used as fully as they can be without putting the system at risk.
MDSS pays attention to indicators such as:
how busy the processors (CPU) and memory are,
how large the backlog of waiting work is,
how quickly scans are being completed,
the health and responsiveness of connected MetaDefender Core scan engines, and
available disk space.
Based on these, its behavior is deliberately smooth and cautious:
It raises throughput when there is a backlog and spare capacity, using more of the available resources to clear work faster.
It settles at a sustainable level when a resource comes under sustained pressure, running it at the highest rate it can sustain instead of overcommitting it and risking instability.
It throttles to protect the system when a resource reaches a critical limit. This can happen when CPU or memory runs out of headroom, when the output pipeline cannot drain as fast as new work arrives, or when the connected MetaDefender Core scan engines cannot take on more scan load. In these situations MDSS reduces how much it takes on so that processing stays reliable and errors are avoided, then returns to full throughput as soon as the pressure clears.
It rests when idle, returning to a light baseline once the backlog is cleared so resources are free for other work.
Built-in safety guardrails
Separately from performance tuning, MDSS includes a safety guardrail that protects your data and the system. If free disk space becomes critically low, MDSS automatically pauses processing so the system does not run out of room, and resumes automatically once space is recovered. When this happens, it shows a message explaining what to do.
The System dashboard
MDSS includes a System dashboard that shows, in real time, what automatic scaling is doing and why. It refreshes automatically every few seconds. The dashboard is for monitoring only; the system tunes itself, so there is nothing to configure here.
The dashboard appears as a System tab alongside the main Dashboard view, for users with the appropriate access.
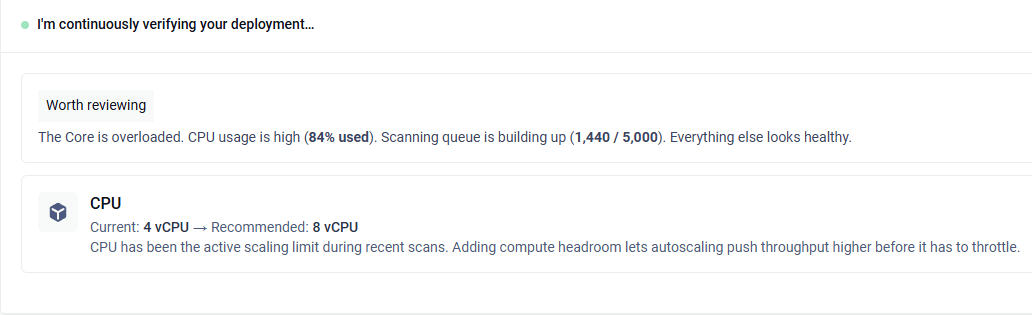
Autoscaling insight
The top card summarizes, in a single sentence, what MDSS is doing right now. Examples include "I'm scaling up to keep scanning moving while you review this," and "I'm continuously verifying your deployment." When there is something to address, it explains the cause in plain language and marks how urgent it is (Action required, Recommended, or Worth reviewing). When everything is healthy, it confirms that no action is needed.
Live status
A strip of key figures gives a quick summary: how many scans are in progress, the current status (such as Scaling up or Idle), what is currently limiting performance (if anything), and how many files are being processed per minute. A History button opens a timeline of recent activity.

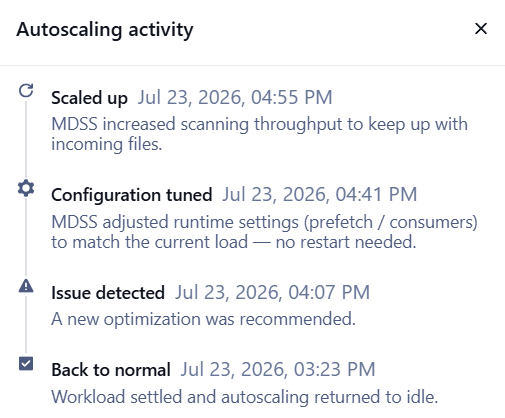
Autoscaling activity
A running timeline of notable events, such as speeding up, slowing down, or pausing. Each event is described in plain language, for example "MDSS increased scanning throughput to keep up with incoming files."
Resource utilization
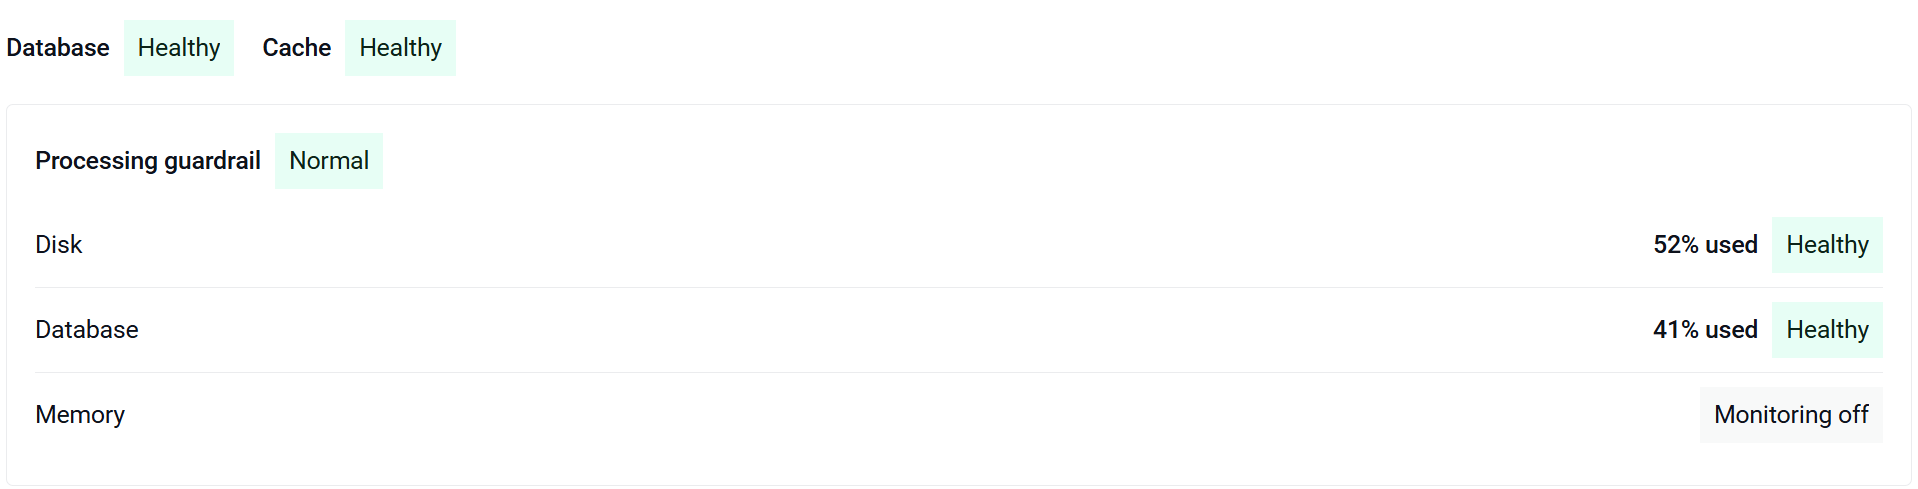
Cards show current usage of CPU, memory, disk, database, and cache, each with a healthy, warning, or critical indicator.

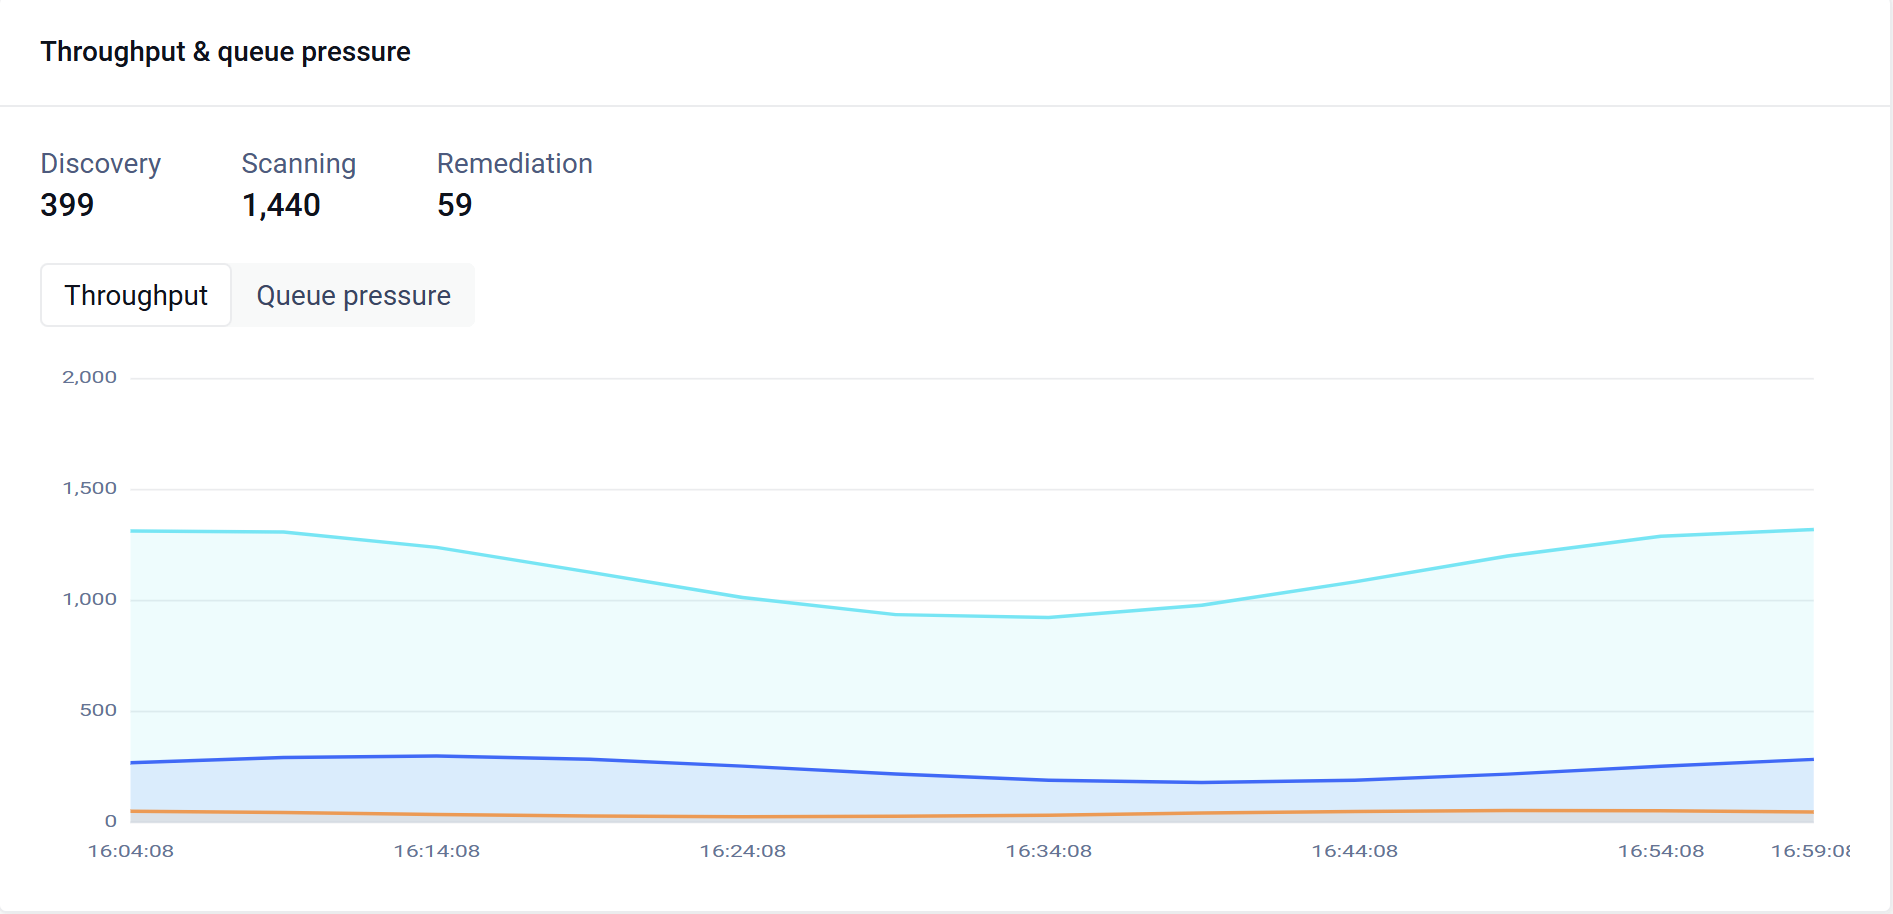
Throughput & queue pressure
Shows how much work is waiting at each stage and lets you switch between two live charts: Throughput (files processed per minute over time) and Queue pressure (backlog size over time). This makes it easy to see whether MDSS is keeping up with incoming work.
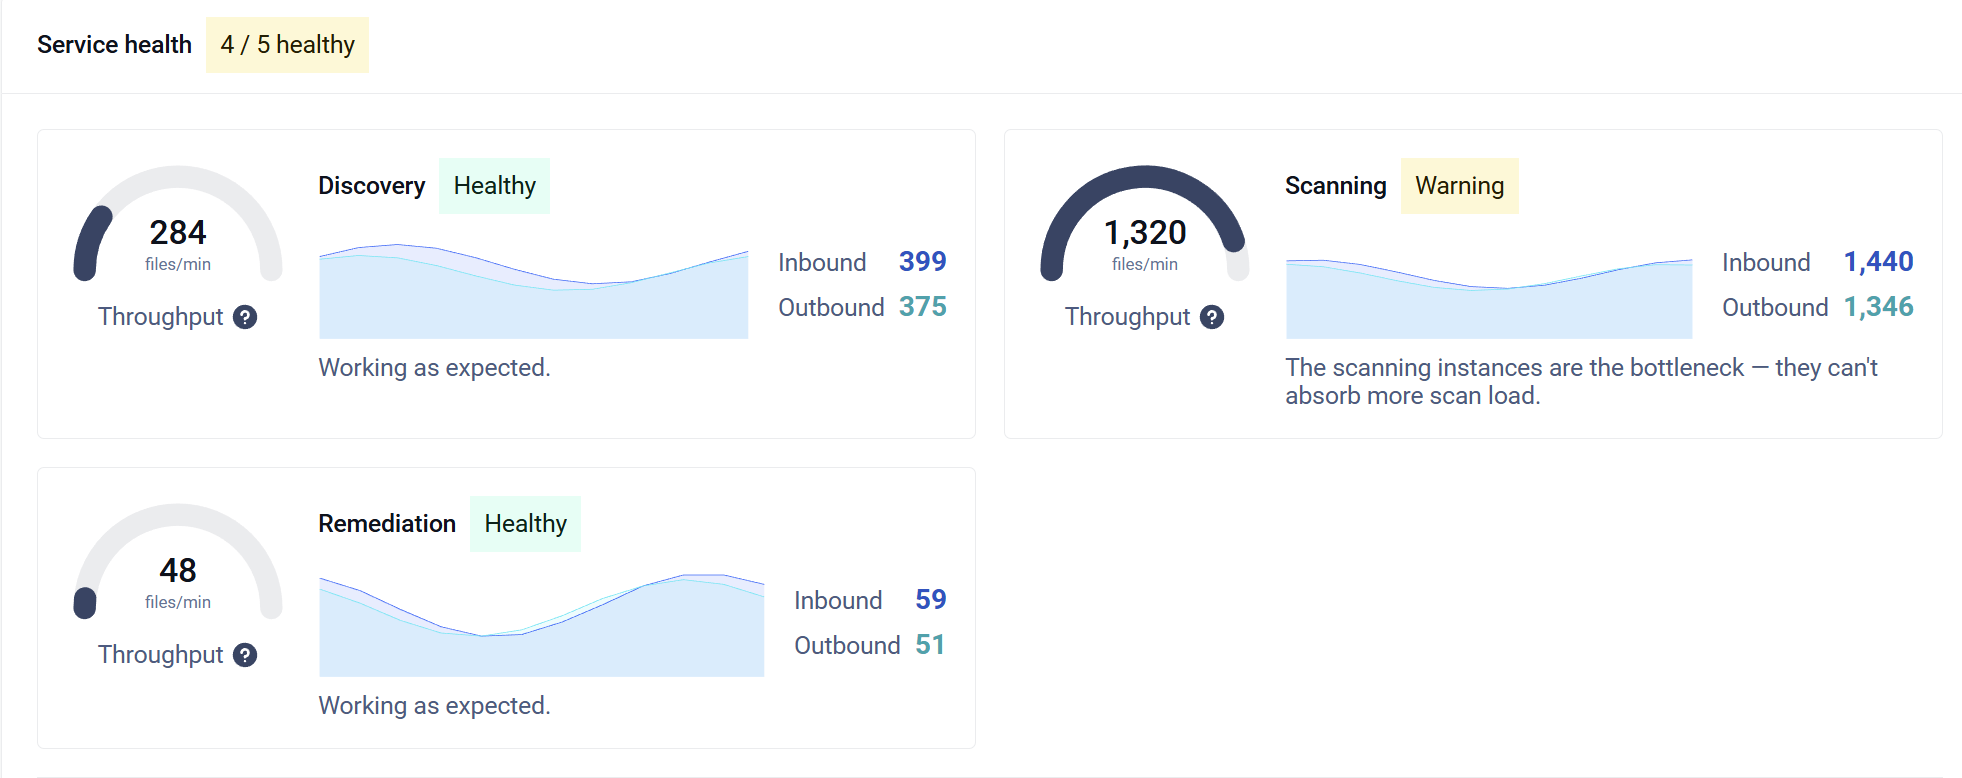
Service health
Shows the health of each MDSS service, with a summary of how many are healthy, each service's current processing rate, and a short explanation of any bottleneck.
MetaDefender Core instances
A table of the MetaDefender Core scan engines currently used by the active jobs, showing each engine's address, health status, and current processing rate. An engine that is holding back overall performance is flagged as a bottleneck.

Processing status
When the safety guardrail is active, a card shows whether processing is Normal or Paused, along with the reason and the current disk space status. If processing is paused, MDSS also shows a banner and a recommended action to resolve it.
Status indicators elsewhere
Beyond the System dashboard, a compact status card appears in the sidebar. If performance becomes degraded, a banner appears across the application with a link to the recommended actions, so you are kept informed even when you are not viewing the dashboard.

Autoscaling states
The Status on the dashboard reflects what automatic scaling is doing at that moment:
State | Meaning |
|---|---|
Idle | Little or no work to do, MDSS is running at a light baseline to conserve resources. |
Scaling up | Demand is high and resources are available, so MDSS is increasing how much it processes at once. |
Holding | Conditions are near a limit, so MDSS is holding steady rather than changing course. |
Scaling down | A resource is under sustained pressure, so MDSS is easing back to relieve it. |
Throttling | A resource has reached a critical limit, so MDSS is temporarily processing less at once to keep things reliable and avoid errors. It returns to full throughput automatically once the pressure clears. See the How it works section for the situations that trigger this. |
Paused | The safety guardrail has paused processing to avoid running out of disk space. Processing resumes automatically once space is recovered. |
Recommendations you may see
When MDSS determines that your hardware or a supporting component has become the limiting factor, it shows a single, prioritized recommendation. Recommendations are advisory. MDSS keeps running as efficiently as it can, and acting on a recommendation will improve performance or resolve a constraint.
Recommendation | Why you are seeing it | What to do |
|---|---|---|
Increase specs | The MDSS host is below the minimum recommended hardware. | Bring the host up to the minimum recommended CPU and memory. |
Increase CPU | Performance is being held back by available CPU. | Add CPU to the host, or add an additional MDSS instance to share the load. |
Increase memory | Performance is being held back by available memory. | Add memory to the host, or add an additional MDSS instance. |
Use an external database | The database is limiting throughput or growing large on the local host. | Move the database to a dedicated external host. |
Use an external cache | The local cache is limiting throughput. | Move the cache to a dedicated external host. |
Use an external MetaDefender Core | The local MetaDefender Core is limiting scan throughput. | Switch to an external MetaDefender Core so scanning can scale independently. |
Increase MetaDefender Core performance | Your external MetaDefender Core is at capacity. | Increase its resources or add more Core nodes. |
Increase storage | Processing was paused because disk space or database capacity is critically low. | Free up or add disk space to resume processing. |
MDSS shows the single most important recommendation at any time rather than a long list, so you can focus on the change that will have the greatest impact.
Turning automatic scaling off
Automatic scaling is enabled by default, and we recommend leaving it on. If you need to turn it off, you can do so with an environment variable:
With this set, MDSS stops adjusting how much it processes and runs at a steady baseline instead. It continues to monitor performance and show the dashboard. Restart MDSS for the change to take effect.
Note: The safety guardrail that pauses processing when disk space is critically low stays active regardless of this setting, so the system stays protected even when automatic scaling is turned off.
Frequently asked questions
Does automatic scaling add or remove servers? No. It makes your existing deployment work as efficiently as possible. When more capacity is needed, it recommends what to add rather than provisioning it for you.
Does automatic scaling slow down my scans? No. It works to complete your scans as fast as possible by using the available system resources as fully and efficiently as it safely can. If a resource reaches a critical limit, MDSS temporarily processes less at once (throttling). This keeps scanning reliable and prevents the system from being overloaded, which would otherwise cause errors or instability. As soon as the pressure clears, MDSS returns to full throughput.
Do I need to configure anything to use it? No. It is enabled by default and self-tuning.
Why does processing sometimes pause? The safety guardrail pauses processing when disk space becomes critically low, and resumes automatically once space is recovered. Follow the on-screen Increase storage recommendation to resolve it.
Why am I seeing a recommendation to add hardware or move a component externally? Because MDSS has determined that resource is currently limiting performance.