Title
Create new category
Edit page index title
Edit category
Edit link
Dashboard
The MetaDefender Storage Security dashboard is the page where you can see an overview of your storage and find information about file processing and usage statistics as well as details about currently running processes or upcoming ones.
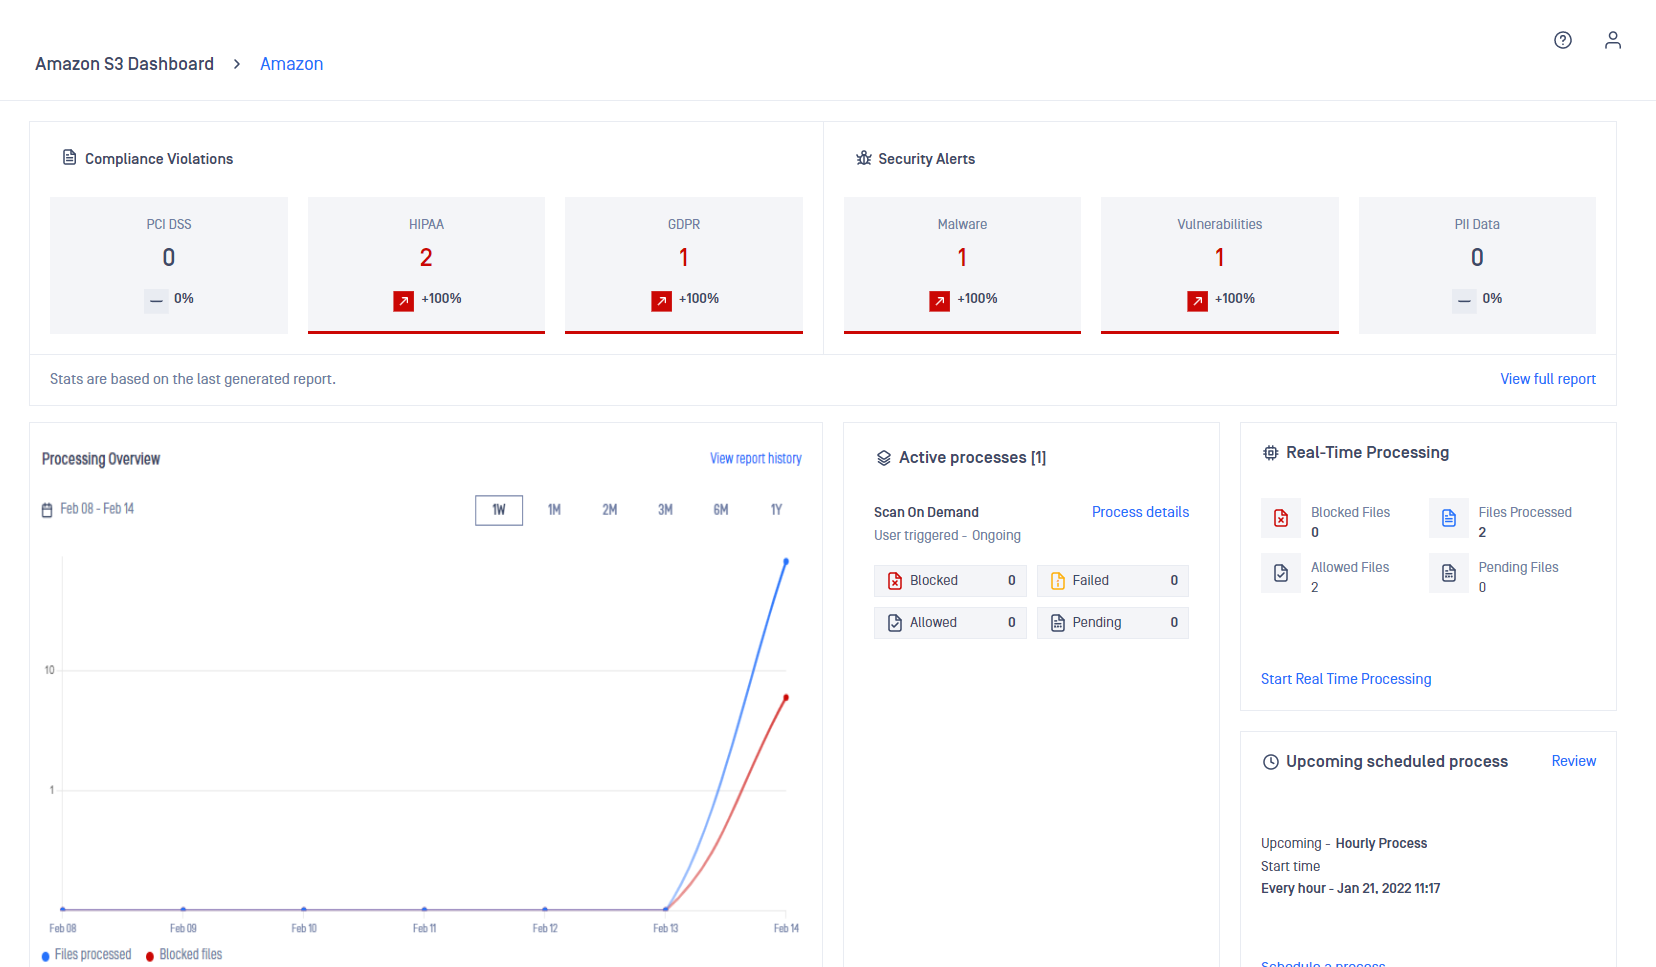
Dashboard Counters
Each storage unit has its own dashboard that displays information about Compliance Violations and Security Alerts.
The table below describes how MetaDefender Storage Security classifies files into different categories of compliance and security issues.
| Category | Compliance | Description | Value |
|---|---|---|---|
| Compliance Violations | PCI-DSS | Payment Card Industry Data Security Standard | The counter is computed as the sum of files which have at least one DLP Hit as CCN (Credit Card Number) |
| HIPAA | Health Insurance Portability And Accountability Act | The counter is computed as the sum of files which have at least one DLP Hit from the following categories:
| |
| GDPR | General Data Protection Regulation | The counter is computed as the sum of files which have at least one DLP Hit from the following categories:
| |
| Security Alerts | Malware | Files detected by anti-malware engines | The sum of potentially dangerous files detected by our multi-scanning technology |
| Vulnerabilities | Files detected by the vulnerability engine | The sum of files with known vulnerabilities, detected by our File-Based Vulnerability Assessment engine | |
| PII Data | Personally Identifiable Information Data | The counter is computed as the sum of files which have at least one DLP Hit from the following categories:
|
Please check the MetaDefender Core sample regular expression page for a list of rules that are being used to match full names, US addresses, birth dates, etc.
The small arrows below each category shows you a percentage increase or decrease based on the previous scan.
Processing Overview
You can select to view data for the last week, month or even the last year. The height of the bar represents the volume of files processed by MetaDefender Storage Security. Hover over it to see more details:
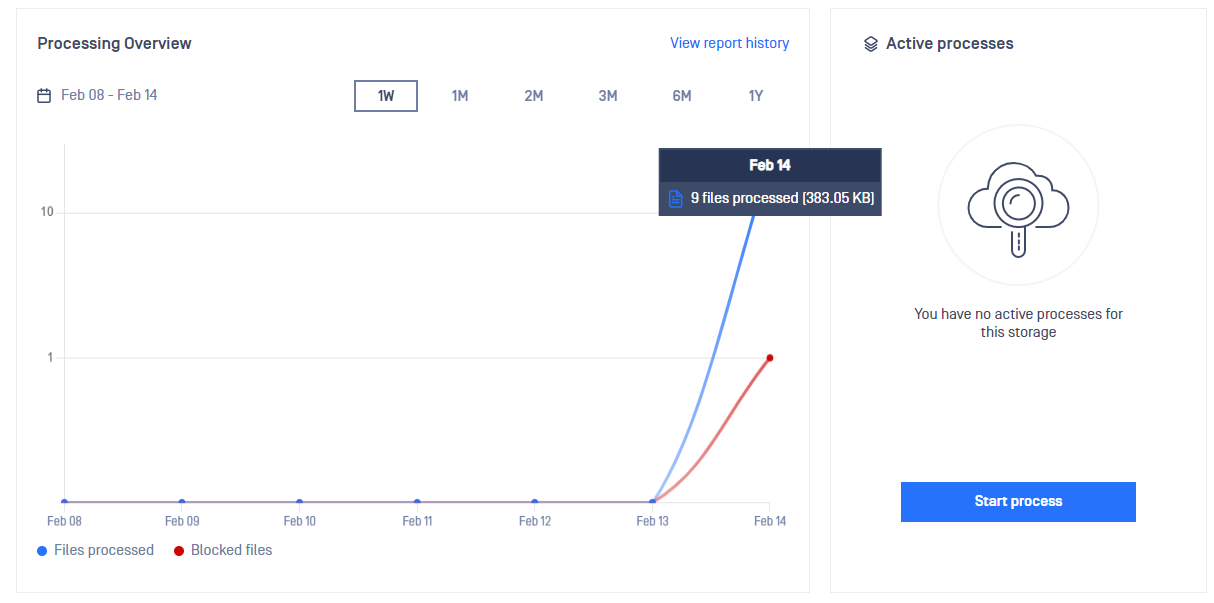
The processed quantity field represents the total amount of data processed with MetaDefender Storage Security. This quantity will exceed your actual storage data if you have triggered more than one process in the defined time unit (day or month). That is because every time you process a file this quantity will be increased even if you’ve processed the same file multiple times.
The number of suspicious files, as well as the counters on the top of the page, represent unique files. If the hash of the file has not changed, MetaDefender Storage Security will only count it once.
Active processes
The right-side area of the dashboard allows you to trigger an instant process of your storage. To do this, click Start process and give this process a name so you can easily identify later.
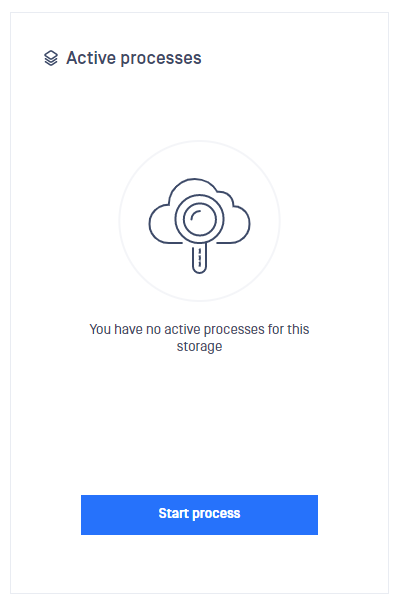
This process represents an Instant process and will produce a report that has ‘Instant’ as a type. This is useful for your to differentiate between scheduled and instant processes.
Please note that this might take a while if your storage contains a significant amount of data. While it is possible for one (or more!) scheduled processes to start while an instant process is running we recommend to avoid that for large storage units.
If that happens, however, you will see a list of your currently running processes in the right-side area for the dashboard and be able to switch between them.
As you can see in the picture below, when a process is in progress the panel will display basic information about this process like the number of pending, blocked or failed files.
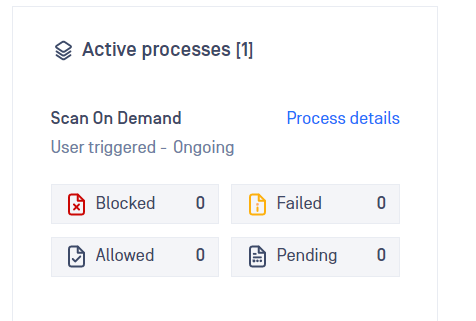
Click Process details if you want to see more information about this process. You will be redirected to a page that contains the following information:
- The progress of the discovery
- Progress of the overall process
- Individual file processing progress
Ongoing process details
When clicking Process details you will be redirected to the ongoing process page:
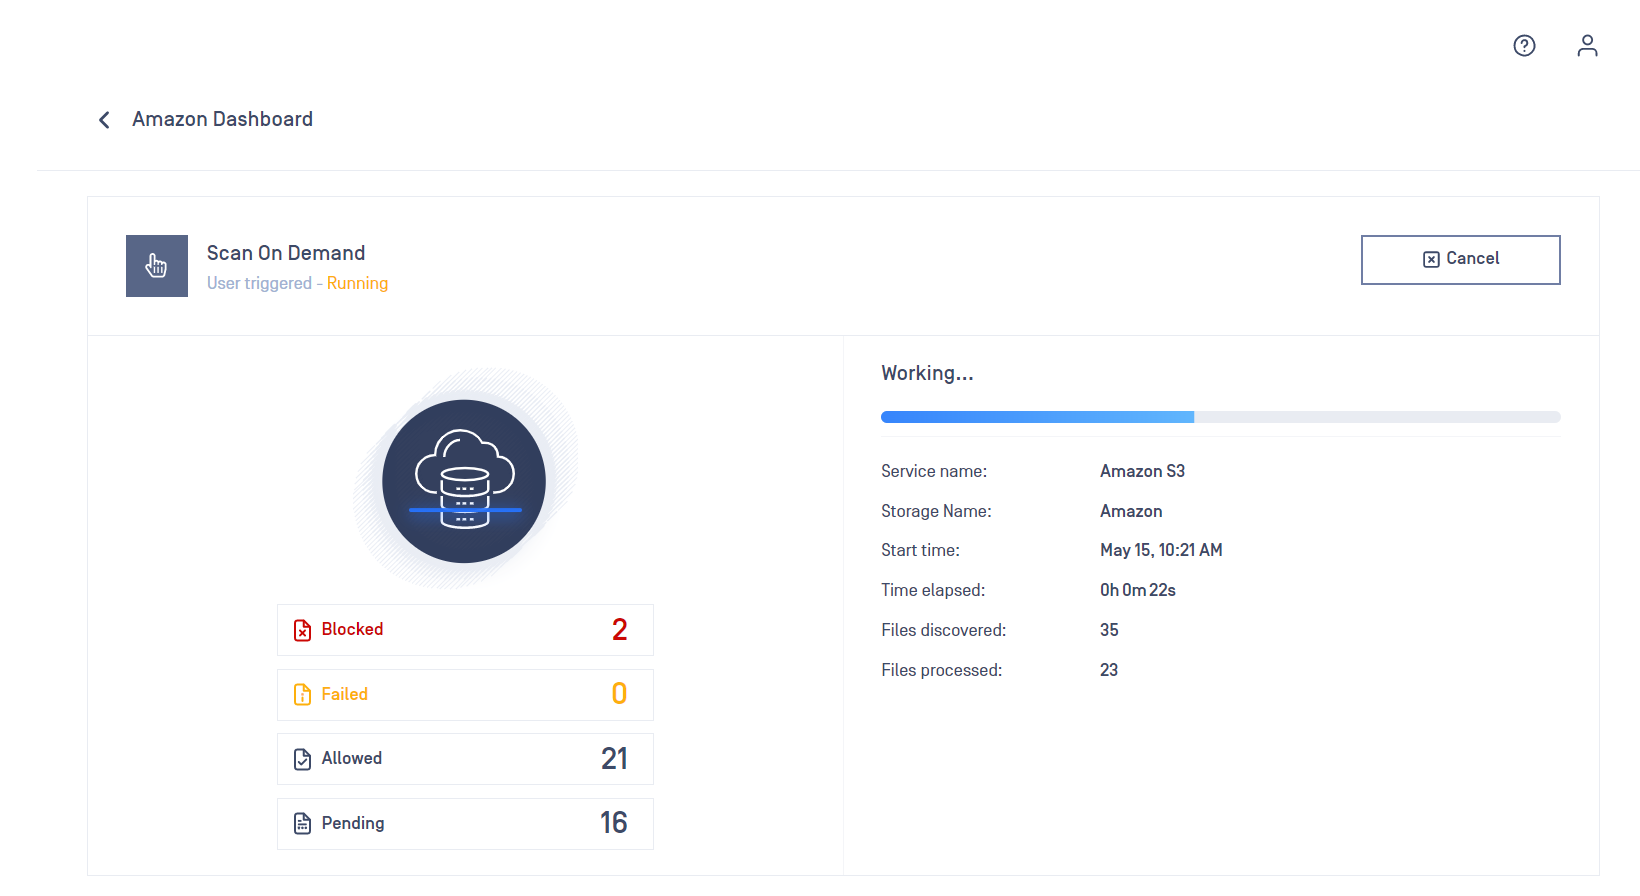
Here you can find the information we previously mentioned as well as the time elapsed since this process was started. Click back if you want to go back to the dashboard.
Real time processing and upcoming processes
On the dashboard page, if you scroll down, you will find more information about real time processing and upcoming scheduled processes. This area, like the whole page, is updated in real time so you can always know what’s happening.
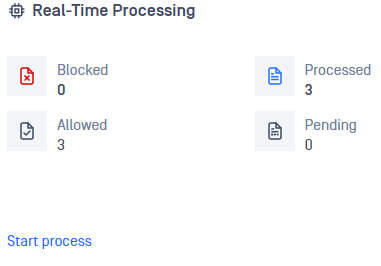
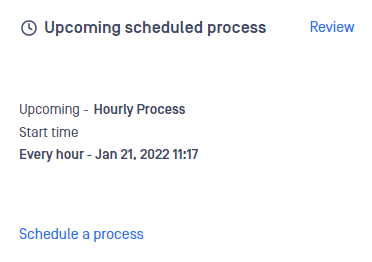
Real time processing requires a lot of internal communication. This could impact the performance of other scans
Starting real time processing and other type of scans in parallel with remediations that modify the files in storage could trigger a loop scanning.
Last 5 reports
At the bottom of the page, there is a list of past reports that you can click in order to find more information about a specific report.
