
The Advanced menu allows super administrators to view and update information about the appliance and to run diagnostics about the appliance.
You must enable the Advanced menu before it becomes visible. Refer to Change Settings for more information.
Diagnostics
Use the Diagnostics menu options to run tests on the instance.
States
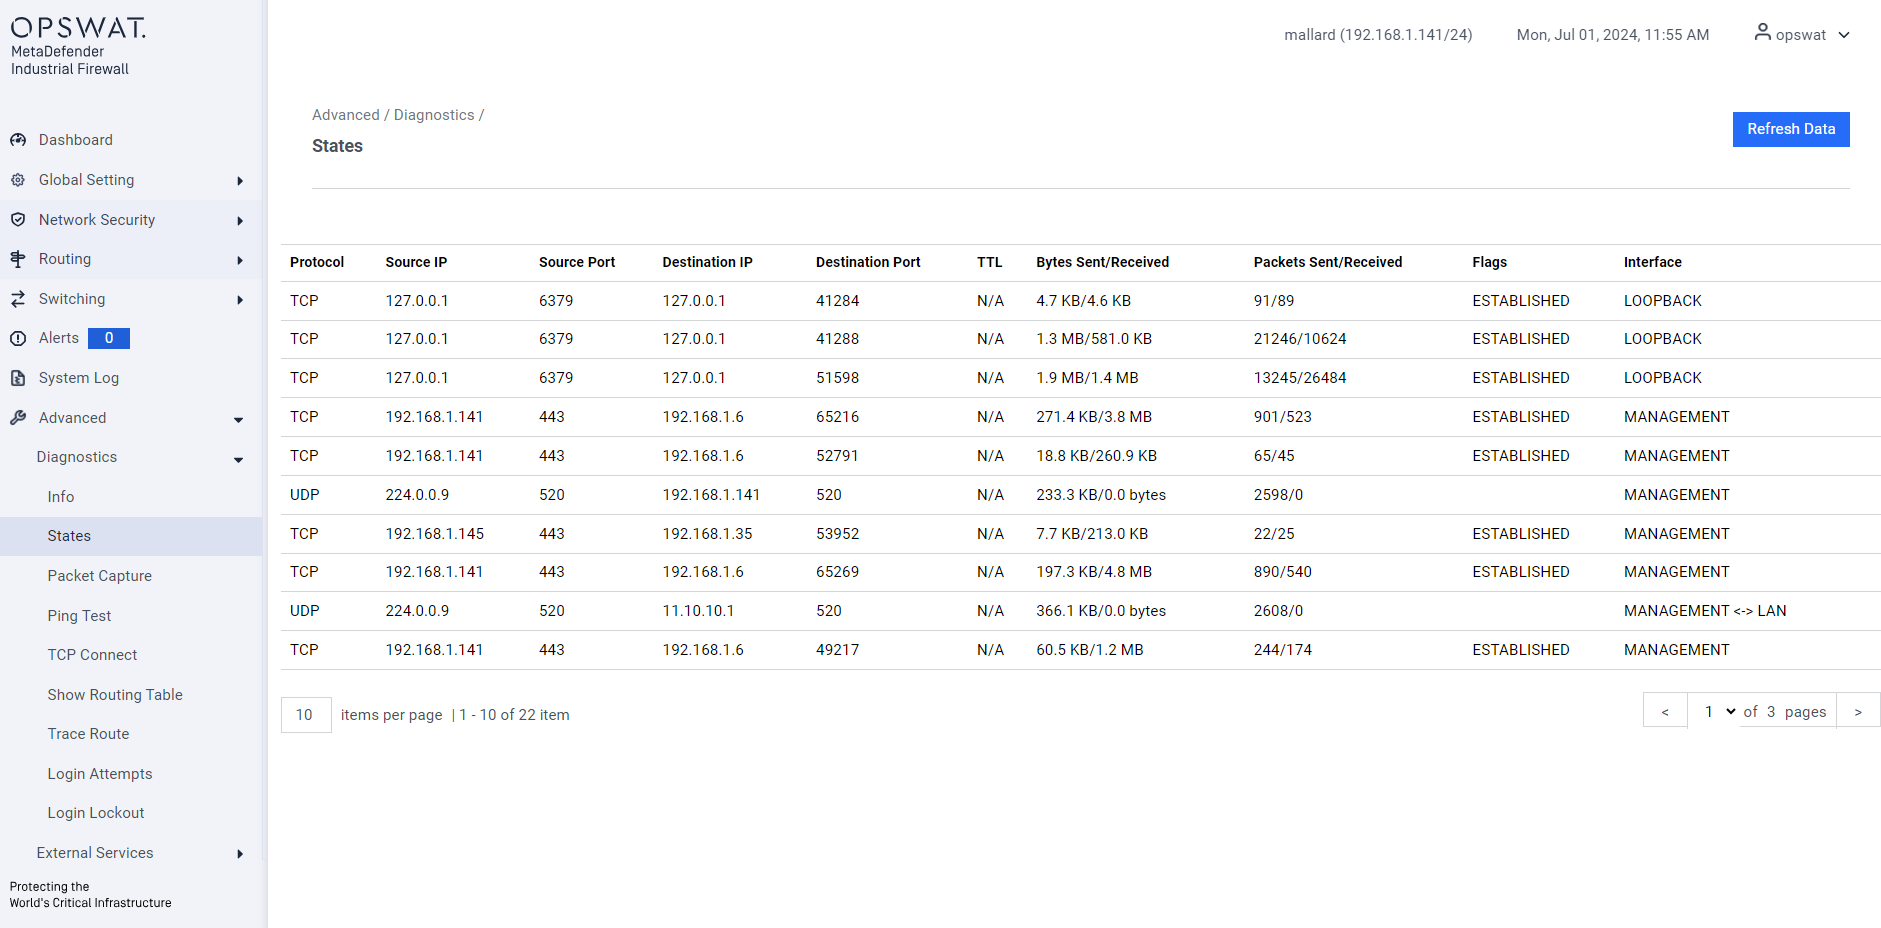
Protocol: The communication protocol used (e.g., TCP, UDP).
Source IP: The IP address of the device sending the data.
Source Port: The port number on the source device.
Destination IP: The IP address of the device receiving the data.
Destination Port: The port number on the destination device.
TTL: Time to live
Bytes Sent/Received: The amount of data sent and received.
Packets Sent/Received: The number of packets sent and received.
Flags: Indicators used to control or identify specific conditions in the communication.
Interface: The network interface through which the data is transmitted.
On Demand Packet Capture
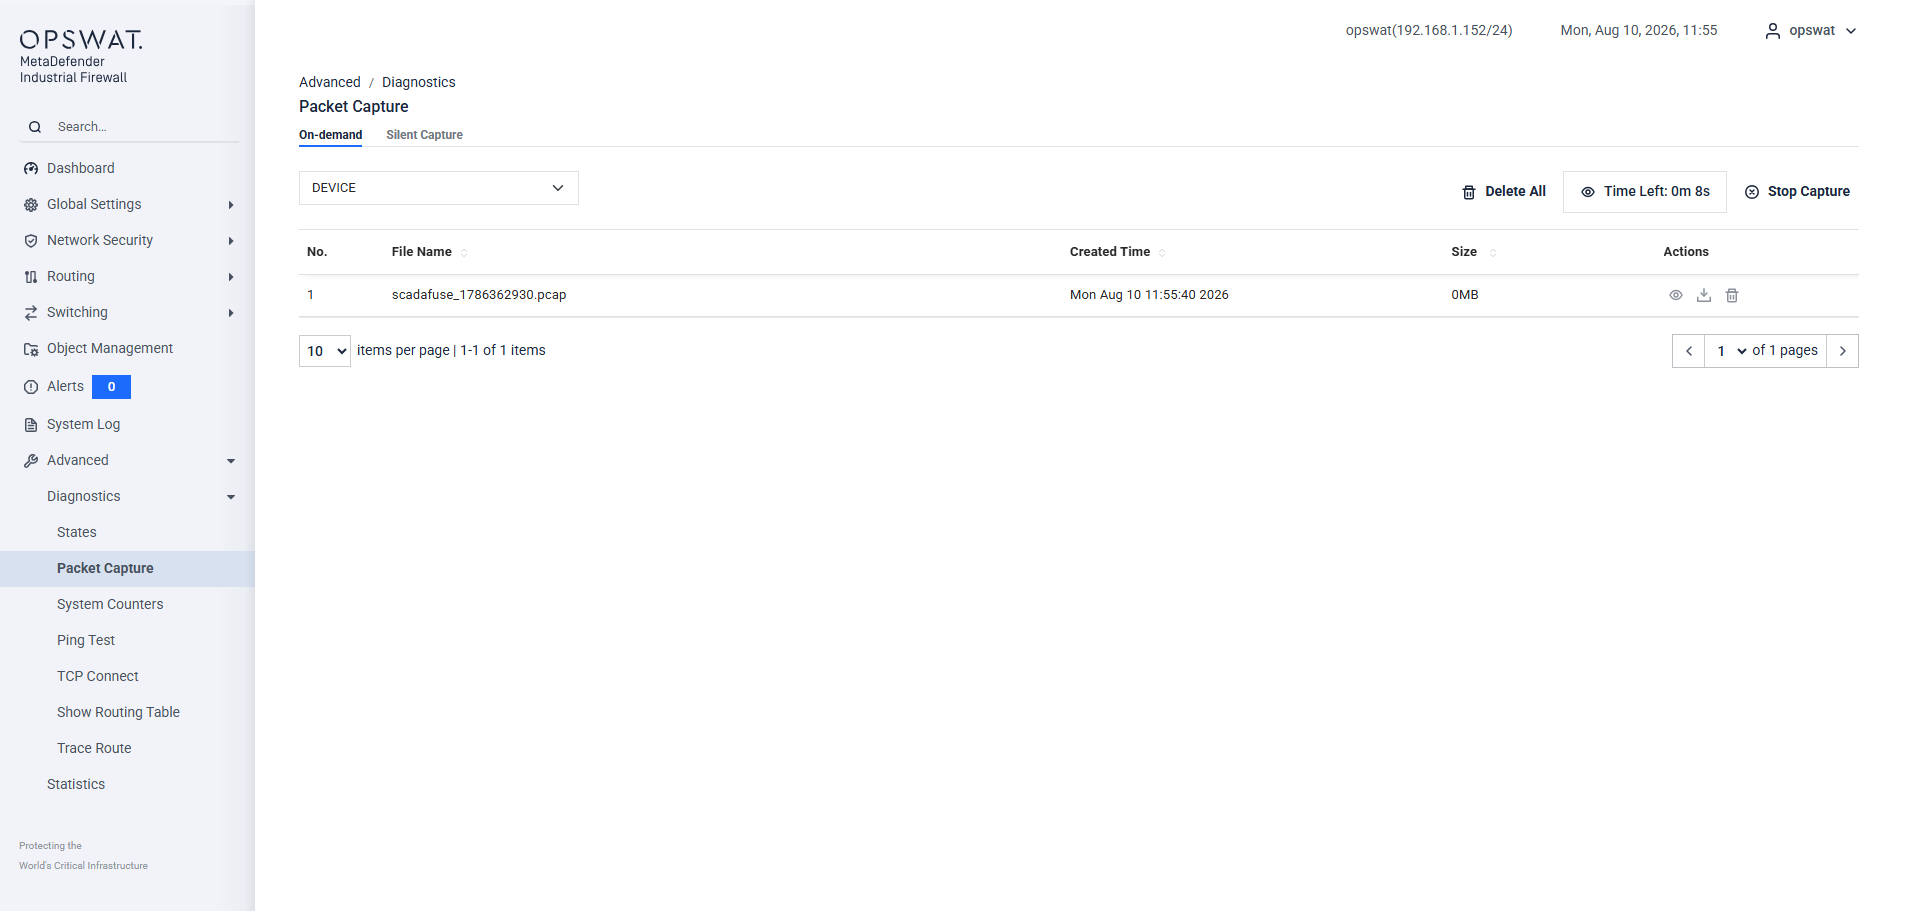
The Packet Capture page allows you to capture and download network traffic directly from a selected firewall interface for troubleshooting, diagnostics, and traffic analysis. This page shows a list of packet capture (.pcap) files created on the firewall and provides controls to start new captures.
Interface Selection:
Select the network interface (e.g. LAN) from the drop-down list.
Packet captures will record traffic only on the selected interface.
Packet Capture Settings:
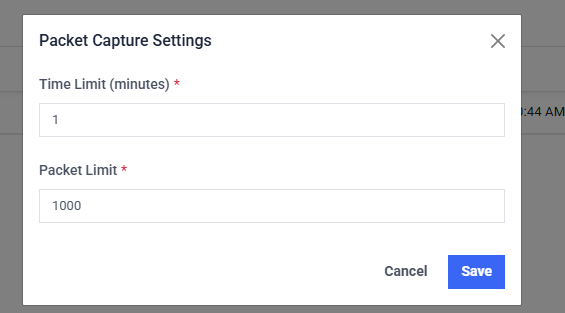
Time Limit (minutes): Specify the maximum duration of the packet capture. The capture automatically stops when the time limit is reached.
Packet Limit: Specify the maximum number of packets to capture. The capture automatically stops when the packet limit is reached.
Starting a Packet Capture:
Select the desired interface.
(Optional) Click Settings to configure capture parameters.
Click Start Pcap to begin capturing packets. The capture runs until it is stopped or reaches configured limits.
Managing Capture Files
Download capture files for analysis using tools such as Wireshark.
Delete unused files to free disk space.
Capture files are stored locally on the firewall.
Operational Notes:
Packet capture may increase CPU and disk usage during capture.
Limit capture duration and file size in production OT environments.
Packet capture does not modify or block traffic.
Silent Packet Capture
The Silent Capture page allows you to record network traffic on one or more interfaces continuously and unattended — for days or weeks — without keeping a browser session open. The session records all selected interfaces into a single rotating set of .pcapng files; each packet is tagged with the interface it arrived on. This page shows the current capture status and the list of capture files, with controls to start and stop the capture.
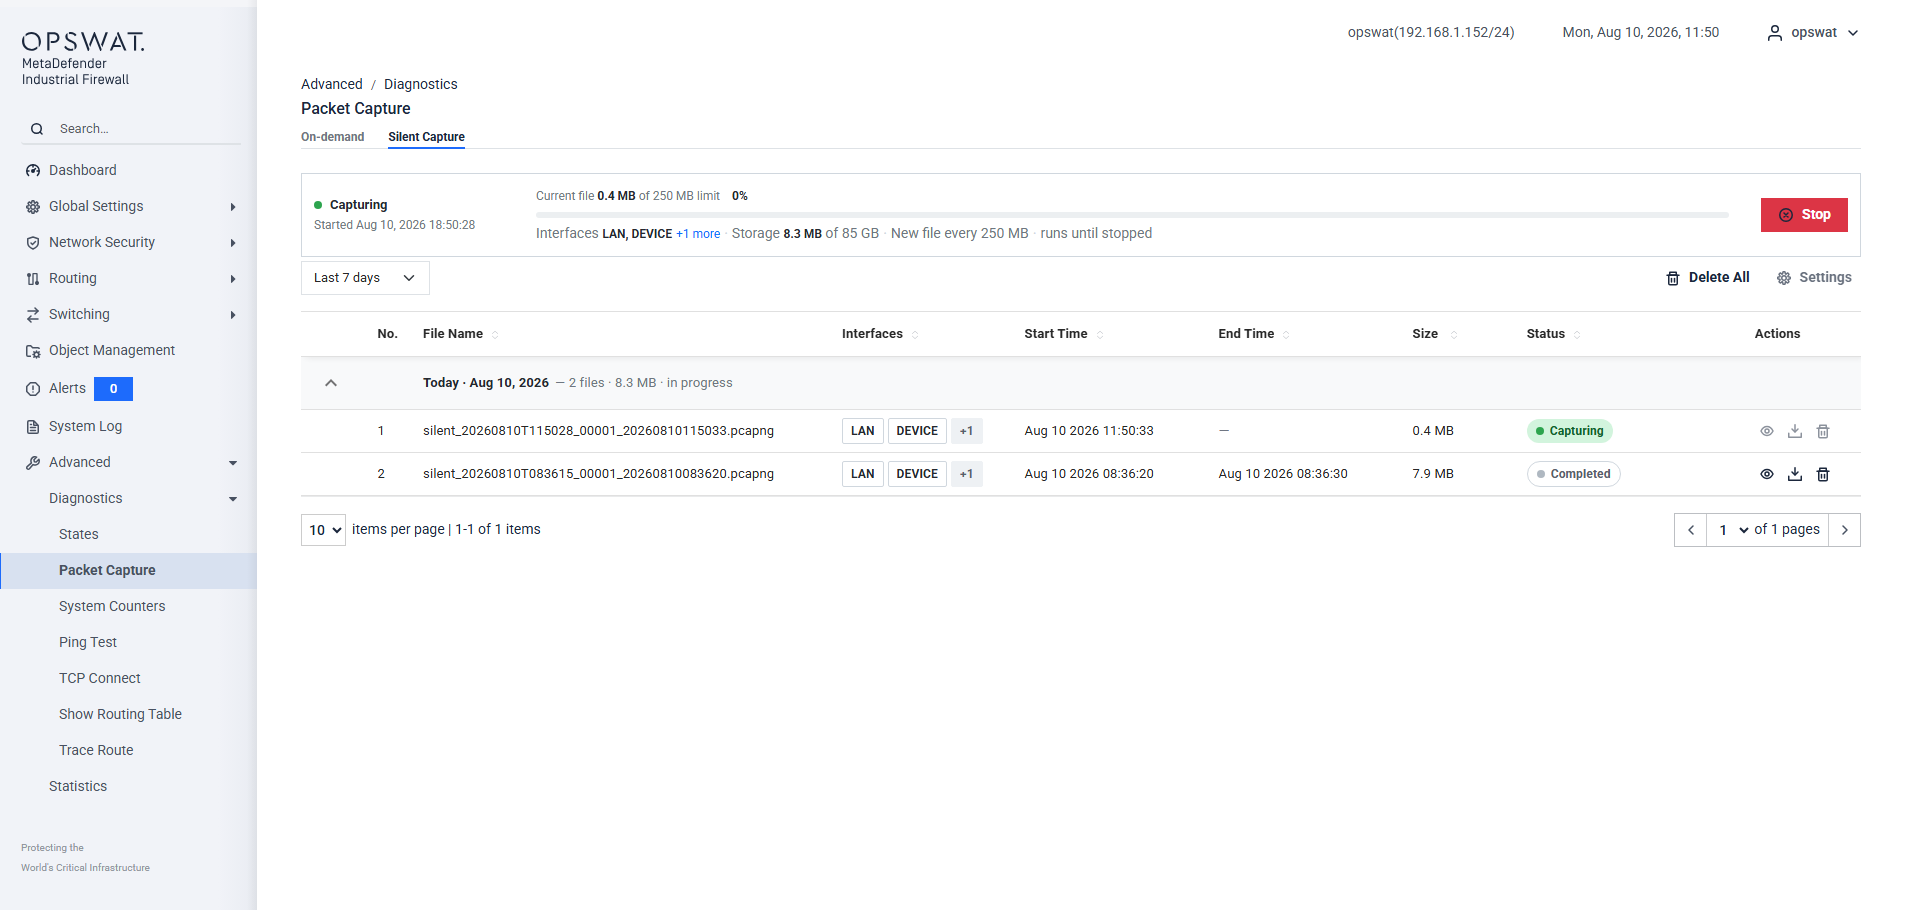
Silent Capture Settings:
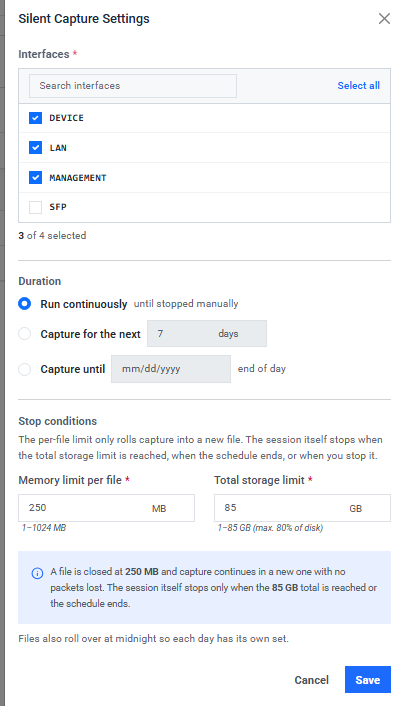
Interfaces: Select one or more interfaces to record. At least one is required; all selected interfaces must be up when the capture starts.
Duration: Run continuously (until stopped manually), capture for the next N days (1–365), or capture until a given date (end of day).
Memory Limit per File: Size at which the current file is closed and capture rolls into a new one (1–1024 MB, default 250 MB). No packets are lost during rotation.
Total Storage Limit: Total disk space all capture files may use (1 GB up to 80% of the device's disk, which is also the default). The session stops when the limit is reached.
Starting a Silent Capture:
Click Settings to select interfaces and configure limits. Settings are locked while a capture is running.
Click Start to begin capturing. The status card shows the session state, current file progress, and storage usage.
Click Stop to end the session. All files are closed and become available for viewing and download.
Managing Capture Files:
Files are listed grouped by day, with interfaces, start/end time, size, and status (Capturing / Completed).
View a completed file for a quick in-browser packet preview; download files for analysis using tools such as Wireshark.
Delete individual files, or Delete All to remove all completed files and free disk space. The in-progress file is always kept.
The file currently being written cannot be viewed, downloaded, or deleted until it rotates or the capture stops.
Operational Notes:
Only one silent capture session can run at a time; it does not modify or block traffic.
Files also roll over at midnight, so each day has its own file set.
A session does not survive a reboot — recording resumes only when started again. The status card shows why the last session ended (schedule, storage limit, reboot, or failure).
Starting is refused with an explanatory message if an interface is down or no longer exists, disk space is insufficient, or the capture service is unavailable.
Read-only users can view status and files; start/stop, settings, download, and delete require administrator privileges.
Hot Processes
Click the Hot Processes option to view a list of processes using a high % of CPU.
System Counters
Click the System Counters option to view a list of counters that provide insight into appliance performance. The list can be sorted by name (alphabetical) or by value (# of counts). You can type into the filter box to search for specific counters.
Ping Test
Click the Ping Test option to run a ping test. Enter the server IP address or hostname in the Target Address box and click the Submit button. The results from the ping display.
TCP Connect
Click the TCP Connect option to view the result of the handshake between the client and the server that’s listening.
Enter an IP address or hostname in the Target Address box.
Enter a port number (required).
Click the Submit button. The handshake results display
Show Route
Click the Show Route option to view the route the packet took to get to its destination. Enter an IP address or hostname in the Target Address box and click the Submit button. The route displays.
Trace Route
Click the Trace Route option to display the route and time the packet took to get to its destination. It will do a maximum of 30 hops at 60 bytes per packet. Enter an IP address or hostname in the Target Address box and click the Submit button. The route and time display.
Statistics
Use the Statistics options to view information about the Processes running on the appliance and the amount of space used by each File System associated with the instance.