Dashboard
MetaDefender Distributed Cluster (MDDC) Control Center provides a Web-based user interface at default port 8892 for user to monitor the system health, system activity and executive report.
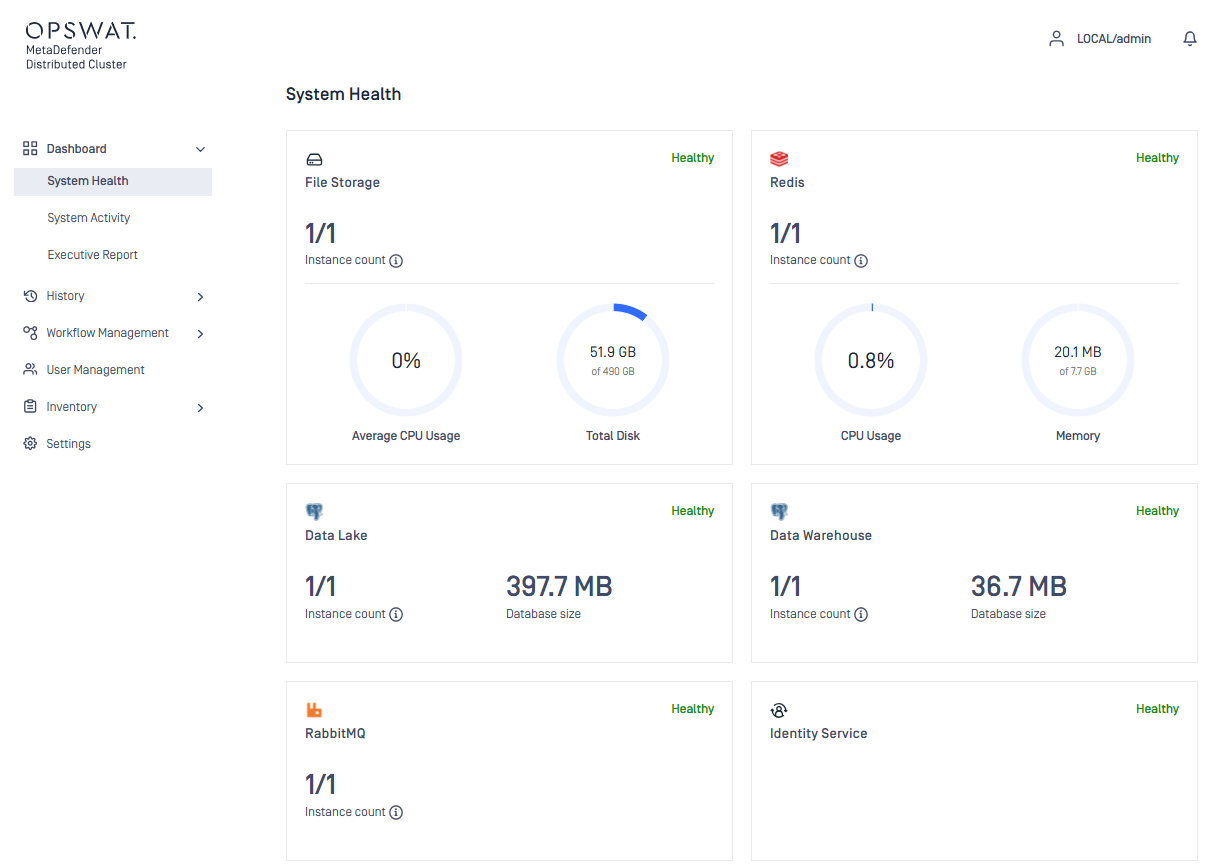
System Health
System Health show the status of all related services:
- File Storage shows the number of MDDC File Storage instances in File Storage cluster added to MDDC. The average CPU usage by the instances and the available over total disk are displayed below.
- Redis shows the number of Redis Caching services in MDDC. Only the CPU usage and free memory amount of the master Redis node are presented.
- RabbitMQ shows the number of RabbitMQ message brokers in the cluster.
- Data lake and warehouse shows the number of Postgres instances including the primary and its replicas. Database sizes are shown.
- Identity Service shows the health status of the MDDC authentication/authorization service.
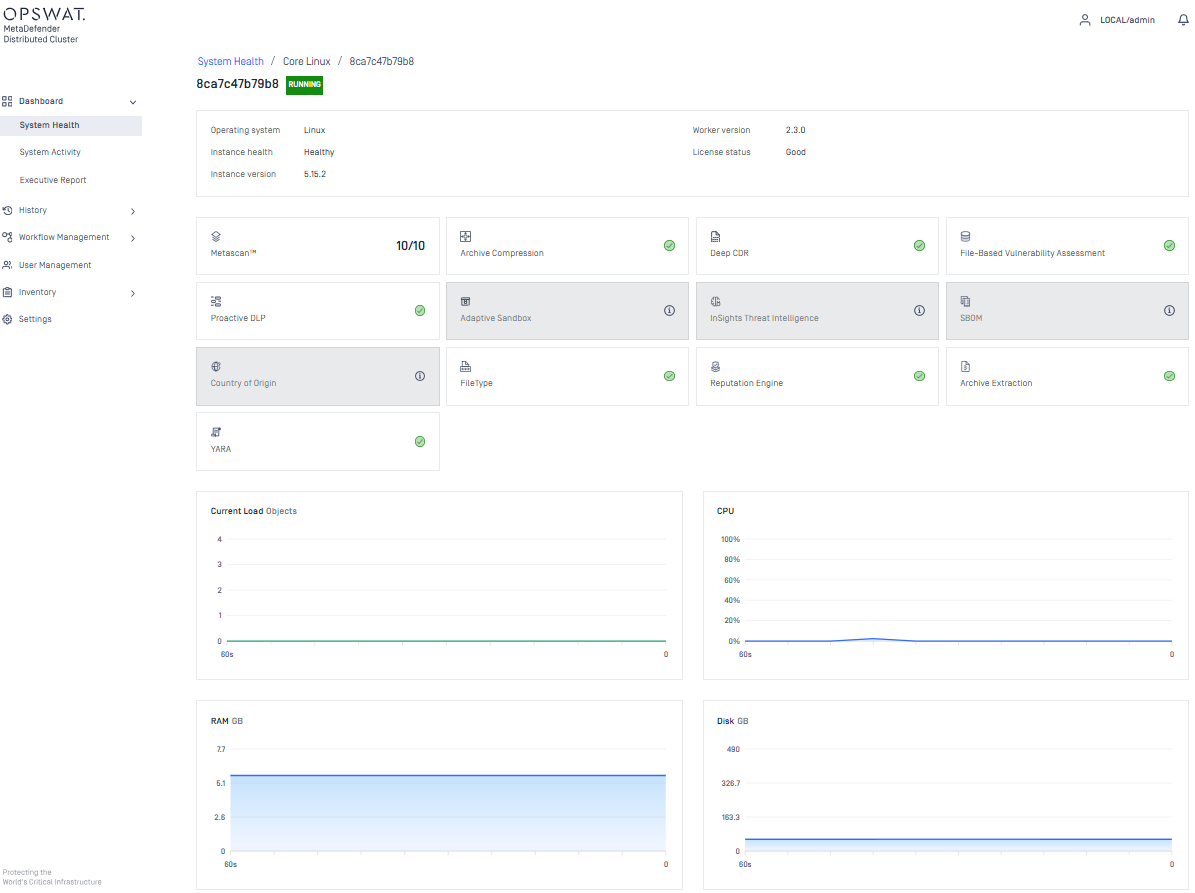
Worker Health
The overall health of all MDDC API Gateway and MetaDefender Core instances of platforms are shown here. The administrator can quickly monitor the number of AV engines installed on each MetaDefender Core instance.

For more details of engines installed on any MetaDefender Core instance, the administrator can hit on the row of that instance. A new page show.
System Activity
The overall System Activity of all MetaDefender Core instances are shown here. There are two sections of this page, System Activity and Instance Activity.
- System Activity shows the overall objects currently being processed, objects currently in-queue and average CPU usage of all MetaDefender Core instances.
- Instance Activity shows individual statistics of all MetaDefender Core instances. This includes Processing Objects, CPU Usage, Memory Usage and Disk Usage.

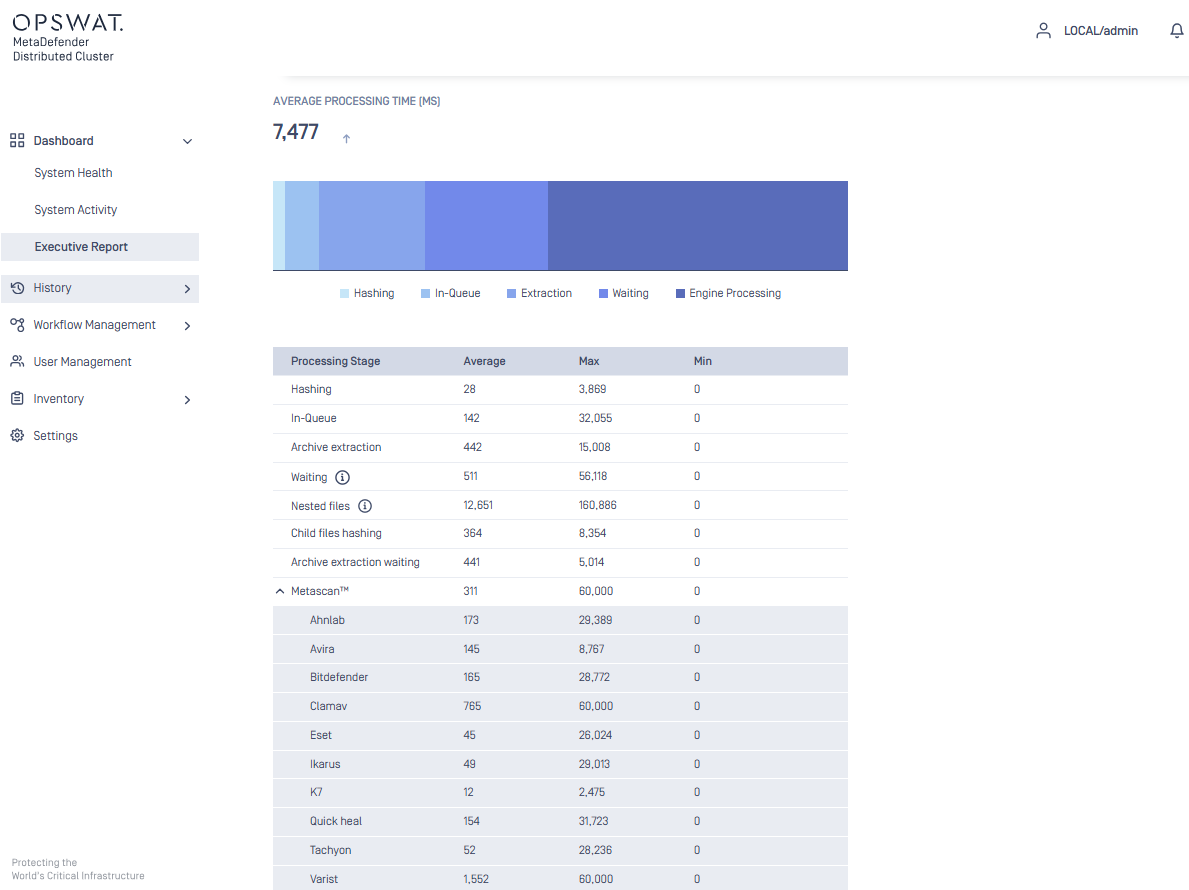
Executive Report
The Executive Report in MDDC provides statistical data on file scanning performance and metrics. This section will provide metrics and values to help you better understand your MetaDefender Distributed Cluster's performance.
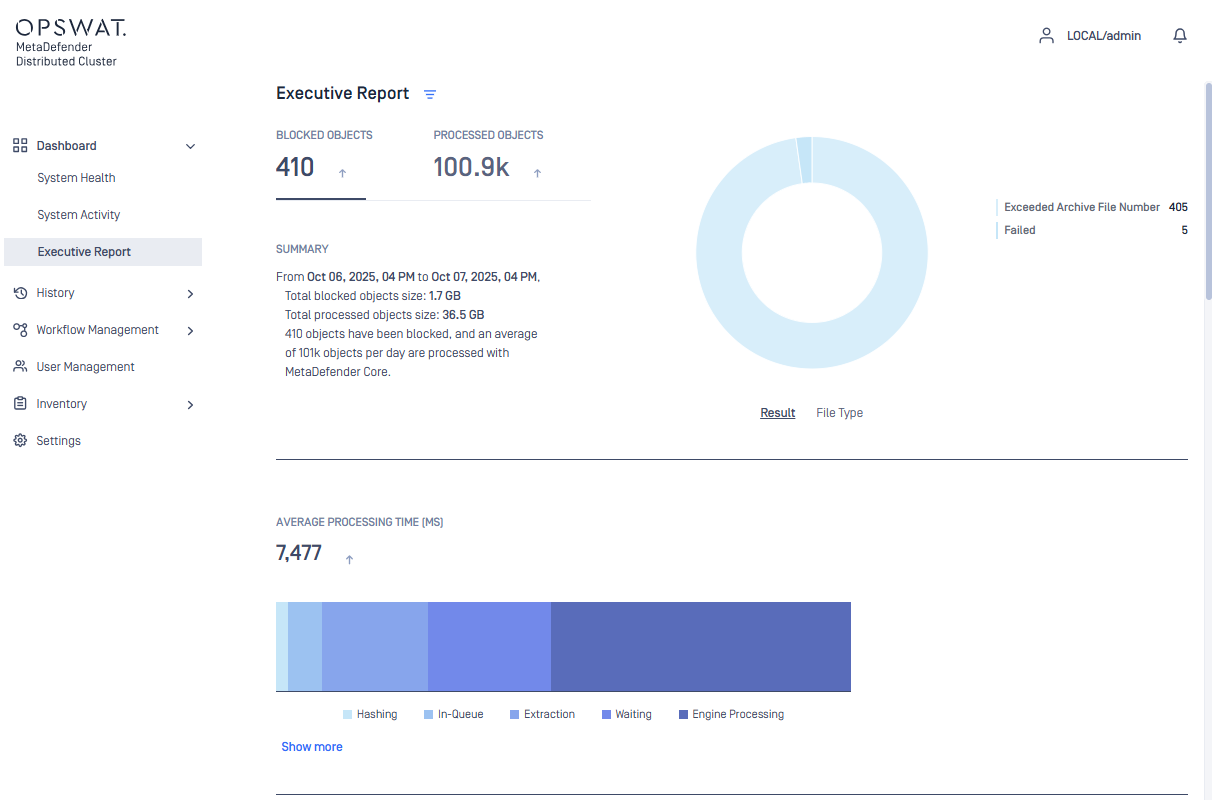
Average processing time will provide detailed information regarding the Processing Stages. The Average, Min and Max will be shown for each stage.
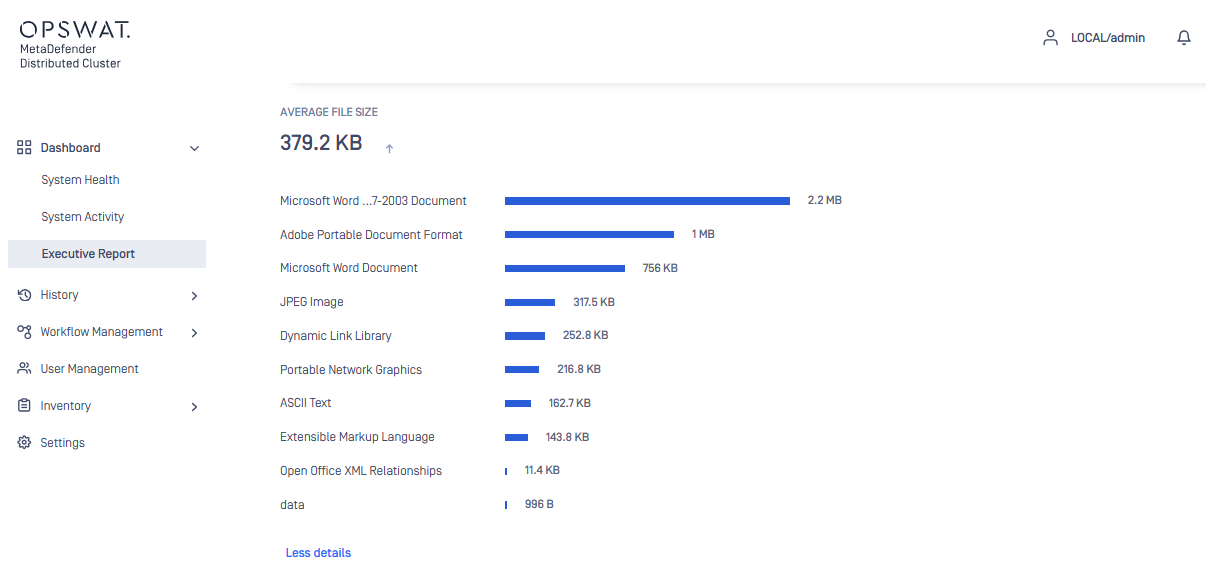
Average file size will provide detailed information on the average file size of file types that were commonly scanned.