Overview
This page assumes MetaDefender Core and Splunk are already installed and running. It only covers wiring the two together.
The Splunk information is used on this page:
Splunk Enterprise
Version: 9.4.3
Deployment: self-hosted container
The MetaDefender Core version is any as long as it supports Syslog
The integration has two sides:
Component | Action |
|---|---|
Splunk | Open a syslog data input and route it into a dedicated index. |
MetaDefender Core | Point its syslog logger at the Splunk host/port. |
Configure Splunk to receive syslog
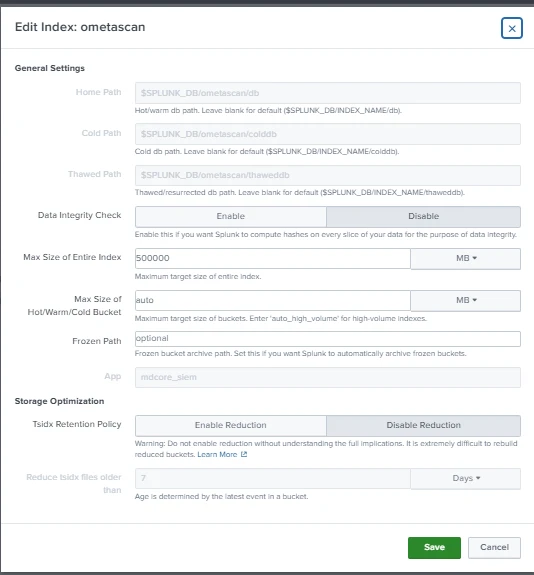
Create a dedicated index and a TCP (and/or UDP) data input that lands MD Core events in it. Add the following stanzas to your Splunk app's local config, or configure them via:
Settings > Indexes > New Index in the UI.
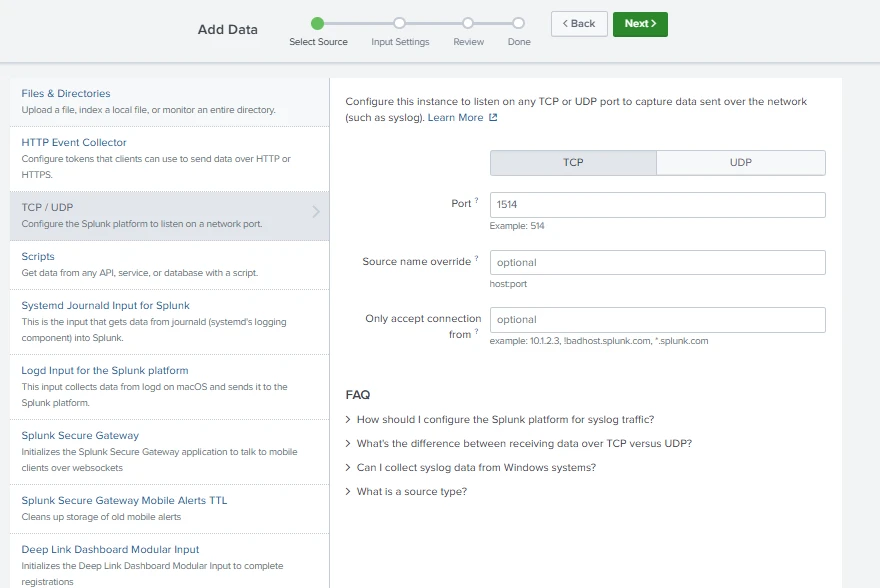
Settings > Data Inputs > TCP > + New in the UI.
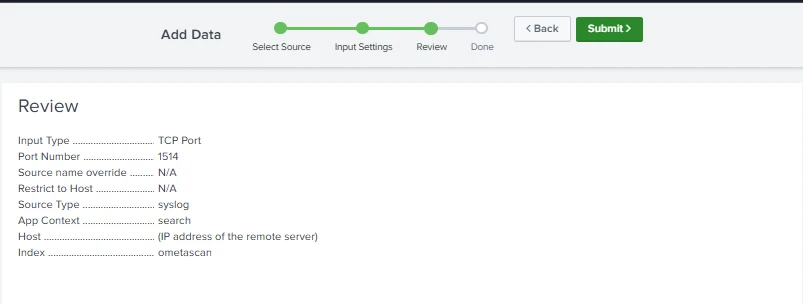
Protocol: TCP or UDP (It is recommended that the user use TCP because it is more reliable)
Port: 1514
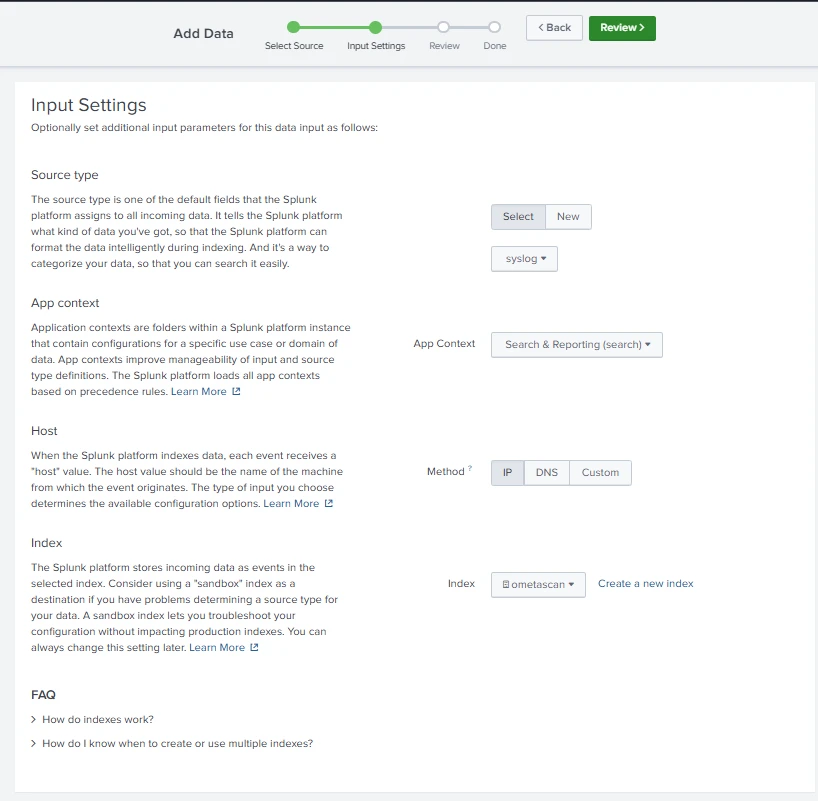
Source type: syslog
Method: IP
Index: use the index name that is created in the previous step
Summary:
Point MetaDefender Core at Splunk
From the MetaDefender Core UI, go to Settings > Logs > down to Splunk > Edit > Add a Connection
Provide the IP address of Splunk and the port:
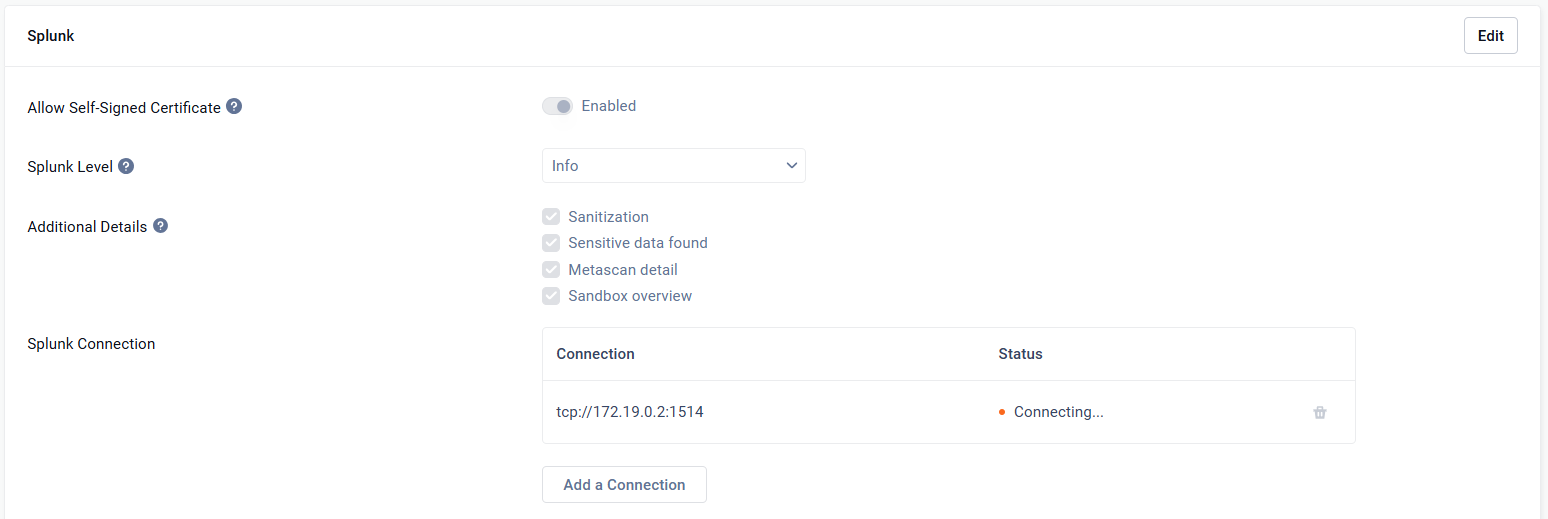
This feature not supported for OPSWAT Central Management yet. When MetaDefender Core is managed by OCM, the option "Additional Details" is not available.
Verify
In Splunk, confirm the input and index exist: Settings > Data inputs shows the 1514 TCP input, and Settings > Indexes shows ometascan.
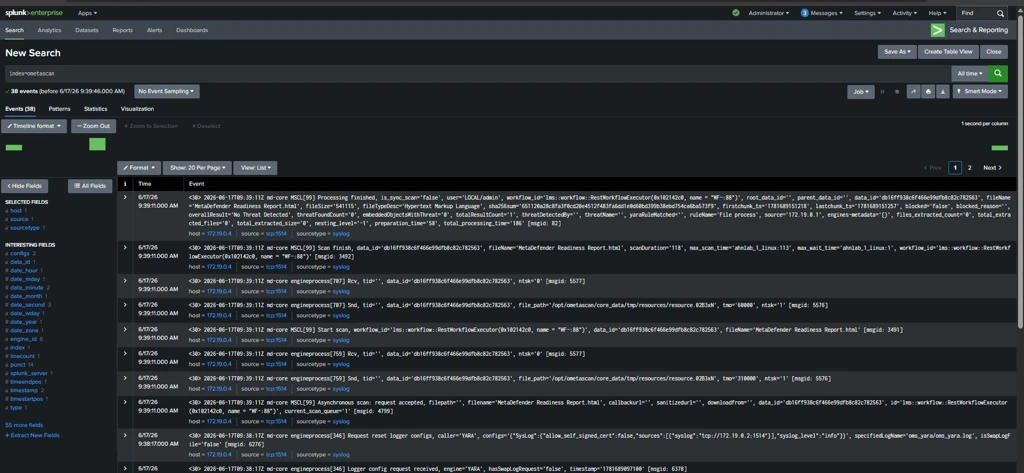
Since an idle MetaDefender Core sends nothing, run a scan in MetaDefender Core to generate events or restart the Ometascan service
Search in Splunk:
index=ometascan
Splunk Dashboard
The user can customize the Splunk Dashboard for themselves. The following steps are to add the suggested dashboard from OPSWAT
In the Splunk UI, go to Apps (top-left dropdown) > Search & Reporting > Dashboards > Create New Dashboard
Provide the dashboard name and choose Classic Dashboards
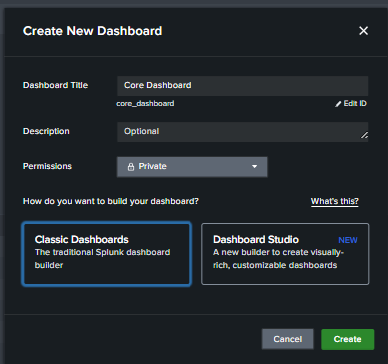
In Edit Dashboard, choose Source and use the following XML code, then click Save
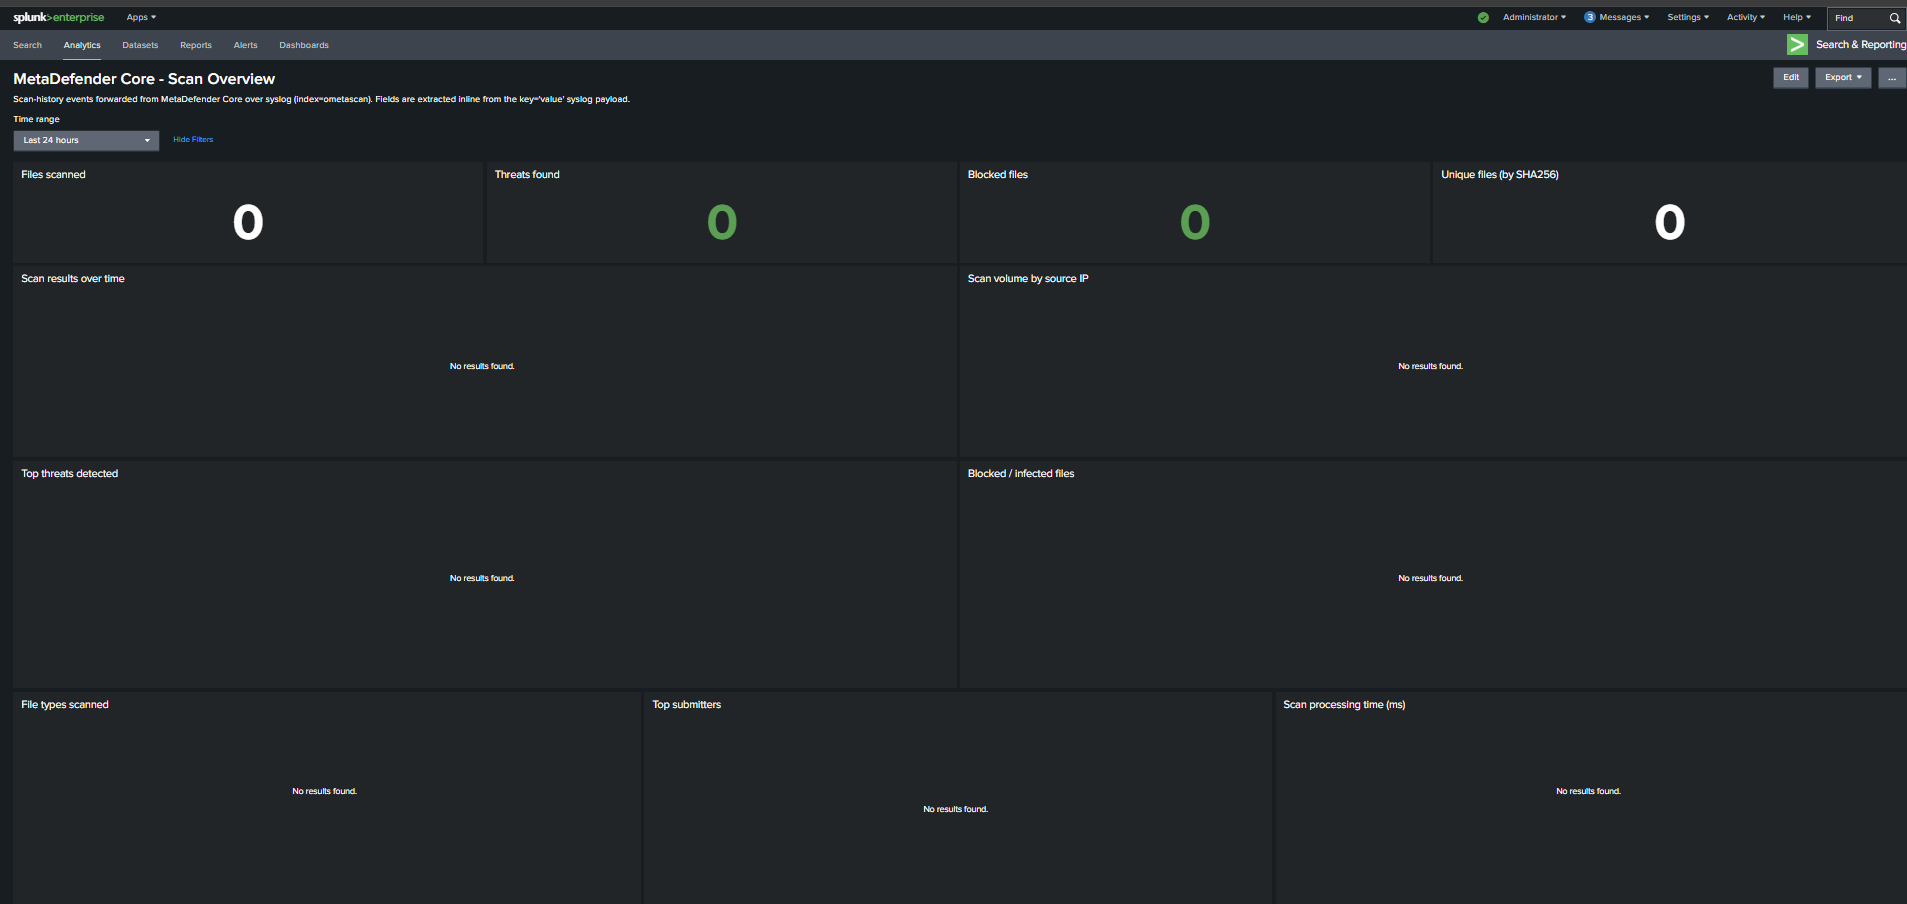
The following is the dashboard after being created: