Info
This page assumes MetaDefender Core and Splunk are already installed and running. It only covers wiring the two together.
Info
The Splunk information is used on this page:
The MetaDefender Core version is any as long as it supports Syslog
The integration has two sides:
Component | Action |
|---|
Splunk | Open a syslog data input and route it into a dedicated index. |
MetaDefender Core | Point its syslog logger at the Splunk host/port. |
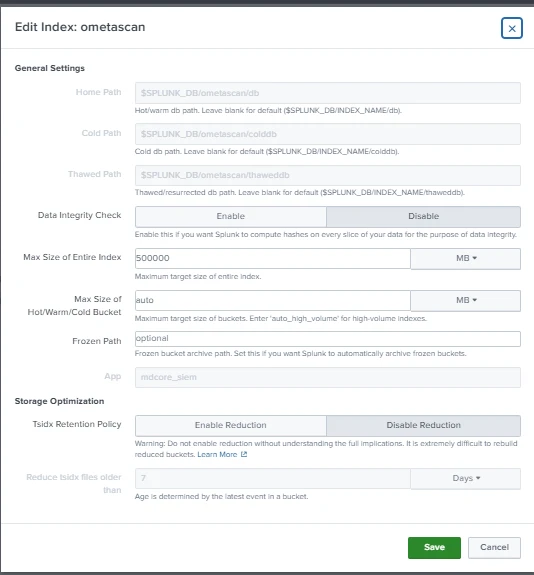
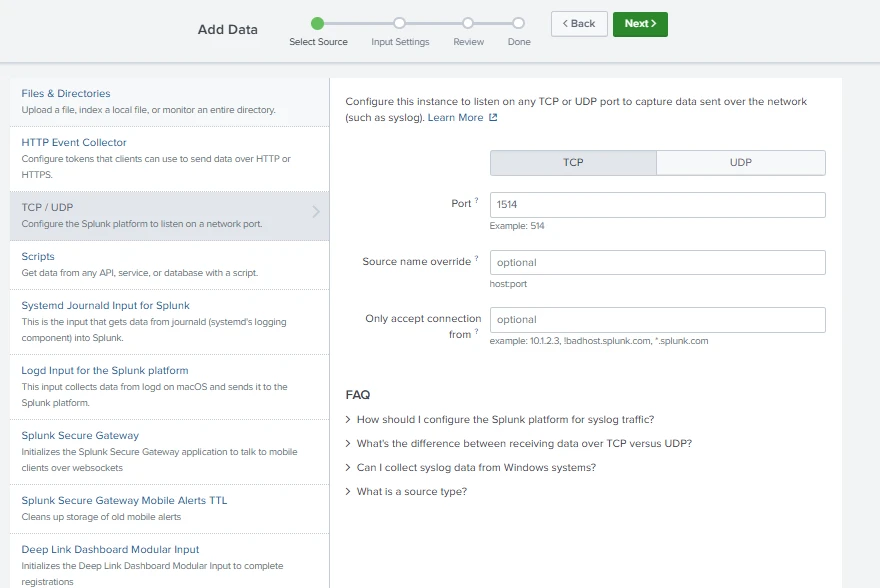
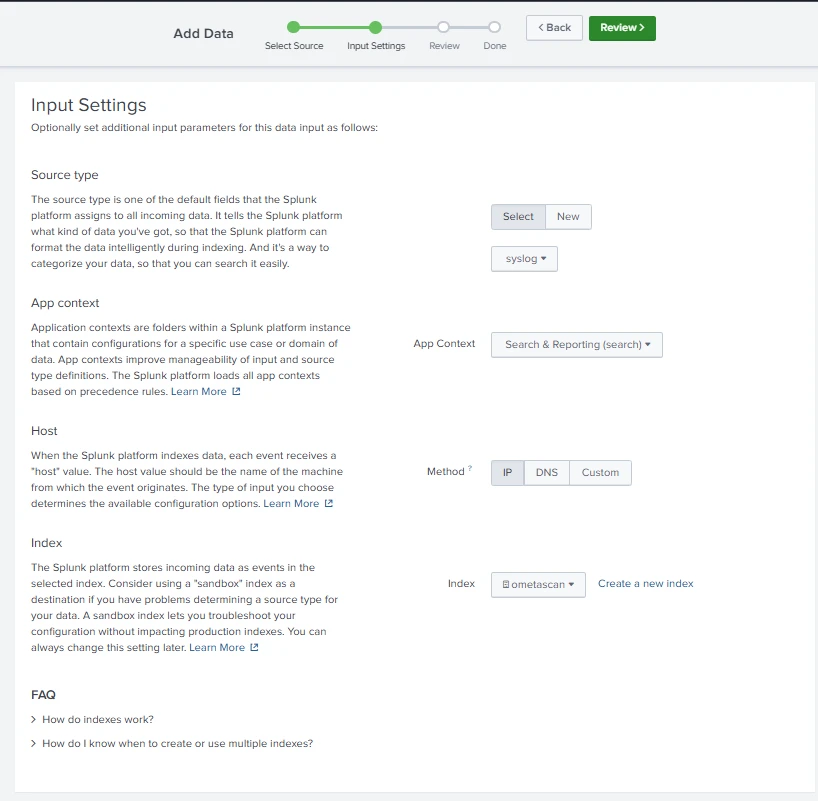
Create a dedicated index and a TCP (and/or UDP) data input that lands MD Core events in it. Add the following stanzas to your Splunk app's local config, or configure them via:
Settings > Indexes > New Index in the UI.
Settings > Data Inputs > TCP > + New in the UI.
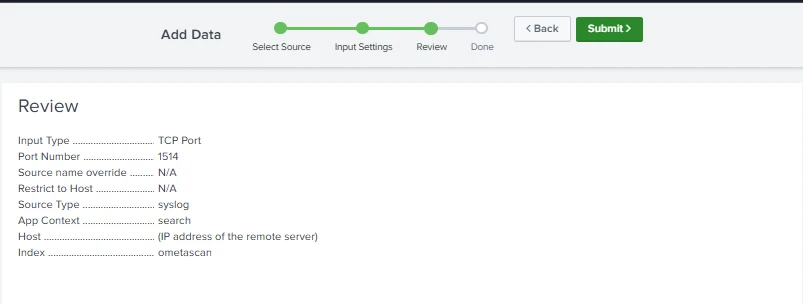
Summary:
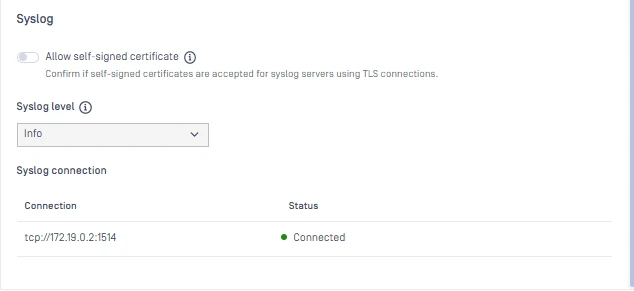
From the MetaDefender Core UI, go to Settings > Logs > click Edit and scroll down to Syslog > + Add a connection
Provide the IP address of Splunk and the port:
In Splunk, confirm the input and index exist: Settings > Data inputs shows the 1514 TCP input, and Settings > Indexes shows ometascan.
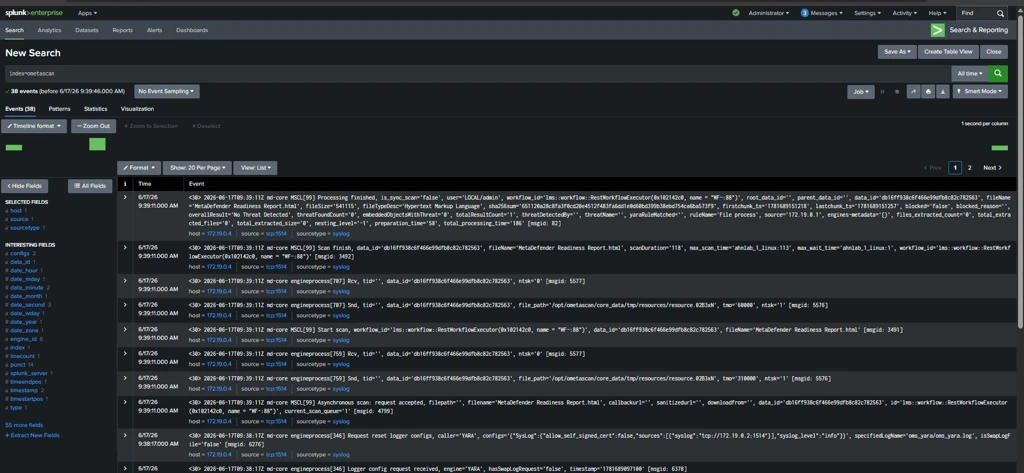
Since an idle MetaDefender Core sends nothing, run a scan in MetaDefender Core to generate events or restart the Ometascan service
Search in Splunk: index=ometascan
Info
The user can customize the Splunk Dashboard for themselves. The following steps are to add the suggested dashboard from OPSWAT
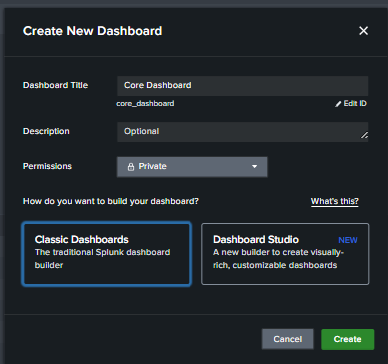
In the Splunk UI, go to Apps (top-left dropdown) > Search & Reporting > Dashboards > Create New Dashboard
Provide the dashboard name and choose Classic Dashboards
In Edit Dashboard, choose Source and use the following XML code, then click Save
<form version="1.1" theme="dark">
<label>MetaDefender Core - Scan Overview</label>
<description>Scan-history events forwarded from MetaDefender Core over syslog (index=ometascan). Fields are extracted inline from the key='value' syslog payload.</description>
<!-- Shared time picker drives the base search -->
<fieldset submitButton="false" autoRun="true">
<input type="time" token="tr">
<label>Time range</label>
<default>
<earliest>-24h@h</earliest>
<latest>now</latest>
</default>
</input>
</fieldset>
<!-- One base search (filters to completed scans + cleans the key='value' fields);
every panel post-processes it, so the raw events are read once. -->
<search id="baseScans">
<query>index=ometascan "Processing finished"
| rex field=_raw "overallResult='(?<overallResult>[^']*)'"
| rex field=_raw "source='(?<src_ip>[^']*)'"
| rex field=_raw "blocked='(?<blocked>[^']*)'"
| rex field=_raw "sha256sum='(?<sha256sum>[^']*)'"
| rex field=_raw "fileName='(?<fileName>[^']*)'"
| rex field=_raw "fileTypeDesc='(?<fileTypeDesc>[^']*)'"
| rex field=_raw "threatName='(?<threatName>[^']*)'"
| rex field=_raw "user='(?<user>[^']*)'"
| rex field=_raw "total_processing_time='(?<total_processing_time>[^']*)'"</query>
<earliest>$tr.earliest$</earliest>
<latest>$tr.latest$</latest>
</search>
<!-- Row 1: KPIs -->
<row>
<panel>
<title>Files scanned</title>
<single>
<search base="baseScans"><query>| stats count</query></search>
<option name="drilldown">none</option>
<option name="colorBy">value</option>
</single>
</panel>
<panel>
<title>Threats found</title>
<single>
<search base="baseScans"><query>| where overallResult!="No Threat Detected" | stats count</query></search>
<option name="drilldown">none</option>
<option name="rangeColors">["0x53a051","0xdc4e41"]</option>
<option name="rangeValues">[0]</option>
<option name="useColors">1</option>
<option name="colorBy">value</option>
</single>
</panel>
<panel>
<title>Blocked files</title>
<single>
<search base="baseScans"><query>| where blocked="true" | stats count</query></search>
<option name="drilldown">none</option>
<option name="rangeColors">["0x53a051","0xf8be34"]</option>
<option name="rangeValues">[0]</option>
<option name="useColors">1</option>
<option name="colorBy">value</option>
</single>
</panel>
<panel>
<title>Unique files (by SHA256)</title>
<single>
<search base="baseScans"><query>| stats dc(sha256sum)</query></search>
<option name="drilldown">none</option>
</single>
</panel>
</row>
<!-- Row 2: Trends -->
<row>
<panel>
<title>Scan results over time</title>
<chart>
<search base="baseScans"><query>| timechart span=1h count by overallResult</query></search>
<option name="charting.chart">column</option>
<option name="charting.chart.stackMode">stacked</option>
<option name="charting.legend.placement">bottom</option>
</chart>
</panel>
<panel>
<title>Scan volume by source IP</title>
<chart>
<search base="baseScans"><query>| timechart span=1h count by src_ip</query></search>
<option name="charting.chart">column</option>
<option name="charting.chart.stackMode">stacked</option>
<option name="charting.legend.placement">bottom</option>
</chart>
</panel>
</row>
<!-- Row 3: Threat focus -->
<row>
<panel>
<title>Top threats detected</title>
<table>
<search base="baseScans"><query>| where overallResult!="No Threat Detected" | top limit=20 threatName</query></search>
<option name="drilldown">none</option>
<option name="count">20</option>
</table>
</panel>
<panel>
<title>Blocked / infected files</title>
<table>
<search base="baseScans"><query>| where overallResult!="No Threat Detected" OR blocked="true" | stats count latest(overallResult) as result values(threatName) as threats by fileName sha256sum | sort - count</query></search>
<option name="drilldown">none</option>
<option name="count">20</option>
</table>
</panel>
</row>
<!-- Row 4: Context and performance -->
<row>
<panel>
<title>File types scanned</title>
<chart>
<search base="baseScans"><query>| top limit=15 fileTypeDesc</query></search>
<option name="charting.chart">bar</option>
<option name="charting.legend.placement">none</option>
</chart>
</panel>
<panel>
<title>Top submitters</title>
<table>
<search base="baseScans"><query>| stats count by src_ip user | sort - count</query></search>
<option name="drilldown">none</option>
<option name="count">20</option>
</table>
</panel>
<panel>
<title>Scan processing time (ms)</title>
<chart>
<search base="baseScans"><query>| timechart span=1h avg(total_processing_time) as "avg ms" p95(total_processing_time) as "p95 ms"</query></search>
<option name="charting.chart">line</option>
<option name="charting.legend.placement">bottom</option>
</chart>
</panel>
</row>
</form>
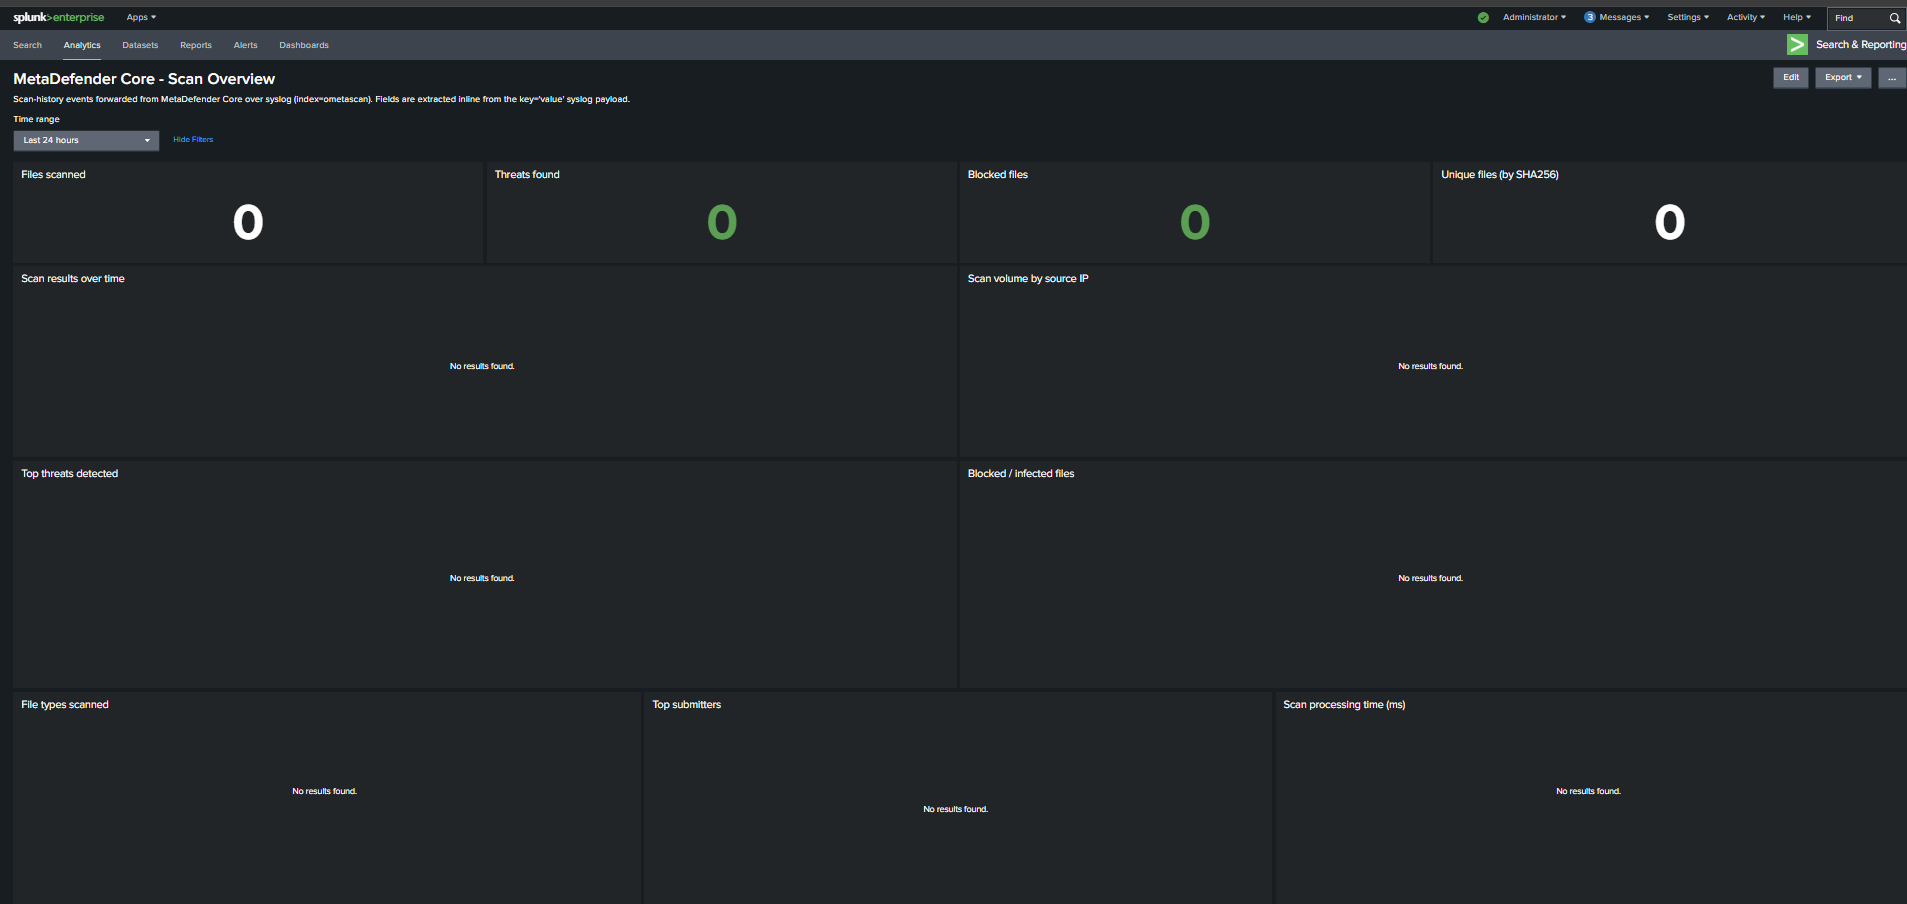
The following is the dashboard after being created: