
MetaDefender Core provides a Web-based user interface (default port is 8008) that gives a general overview of MetaDefender Core status and allows you to configure its options.
Note that the default auto refresh rate of displayed information is 30 seconds.
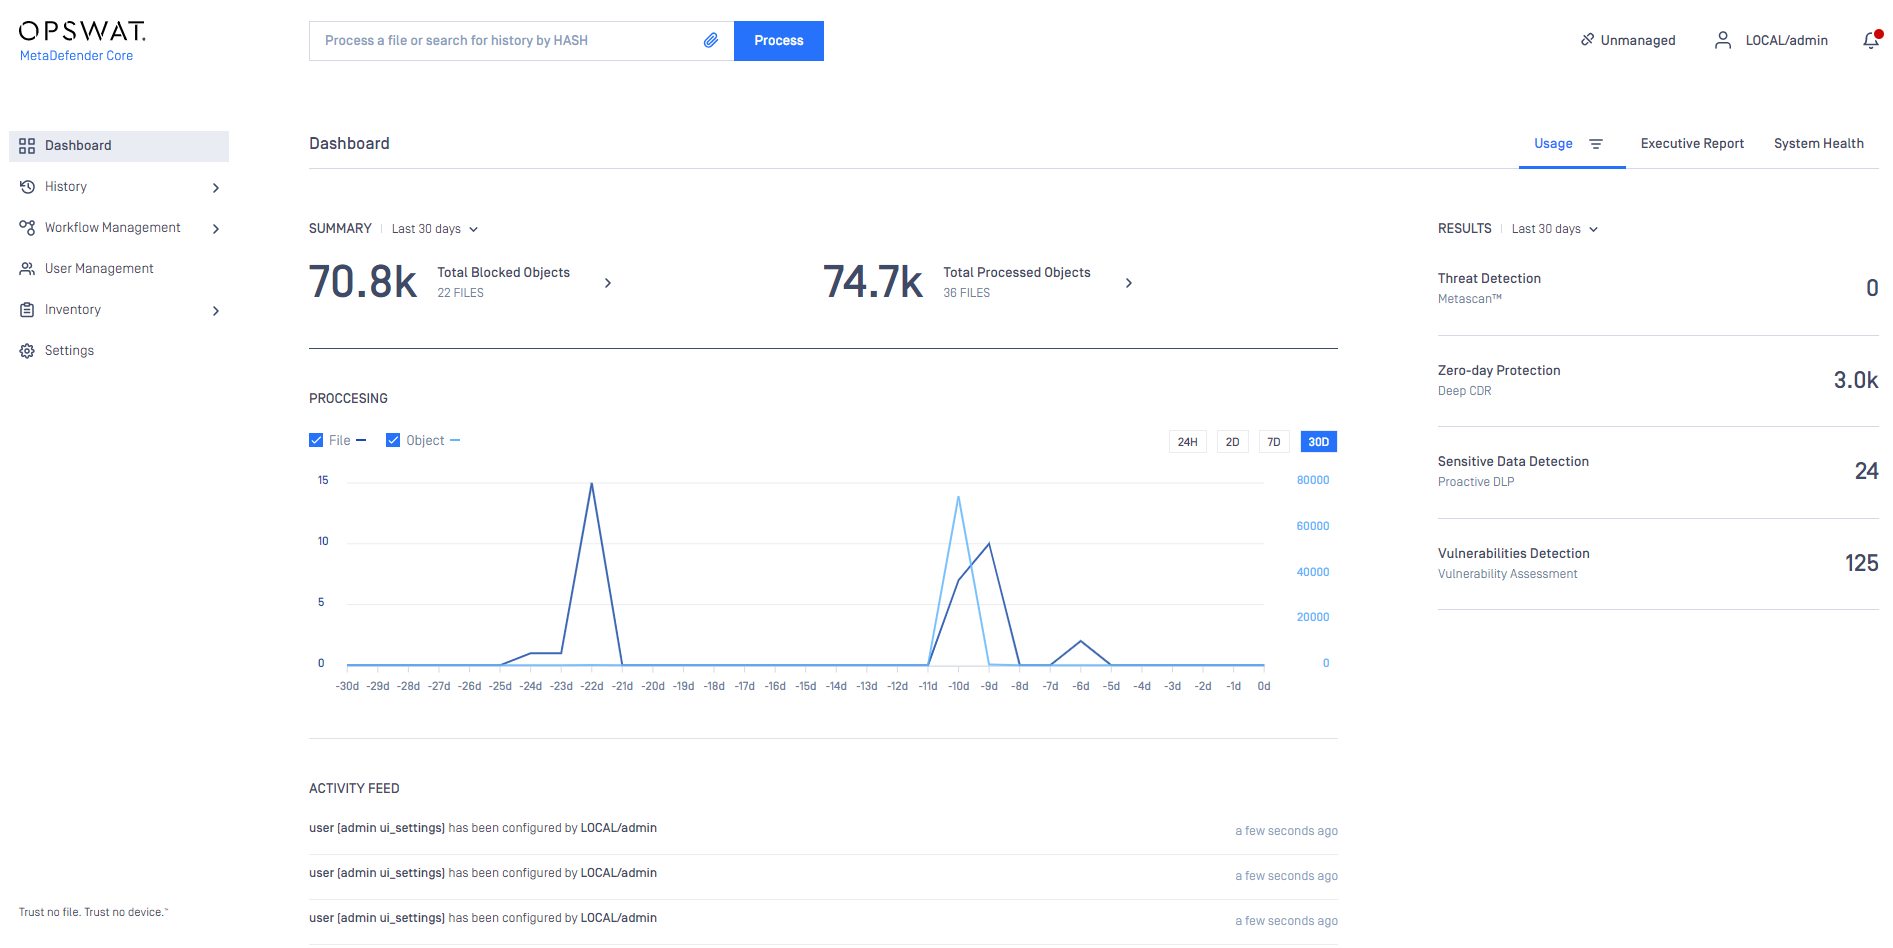
Overview page
The Overview page shows information on
Number of threats detected
Number of files sanitized
Number of detected vulnerabilities
Total number of files processed
Average load of all nodes
Number of active anti-virus engines against total number of AV engines
The proportion of used and usable Data Sanitization file types
Number of known CVEs and file hashes in the vulnerability database
The proportion of used and usable non-AV engines (external scanners, filetype an archive engines)
Number of connected nodes
Number of scanned objects in the last 30 days
Statistics on number of processed files in time (line chart)
Statistics on processing results (two doughnut charts)
Both the default refresh rate (default is 1 minute) and the span of time displayed (24 hourss) can be changed.
Executive Report
The executives report page is to provide all needed statistics processed data.
The span of time displayed (24 hourss) can be changed.
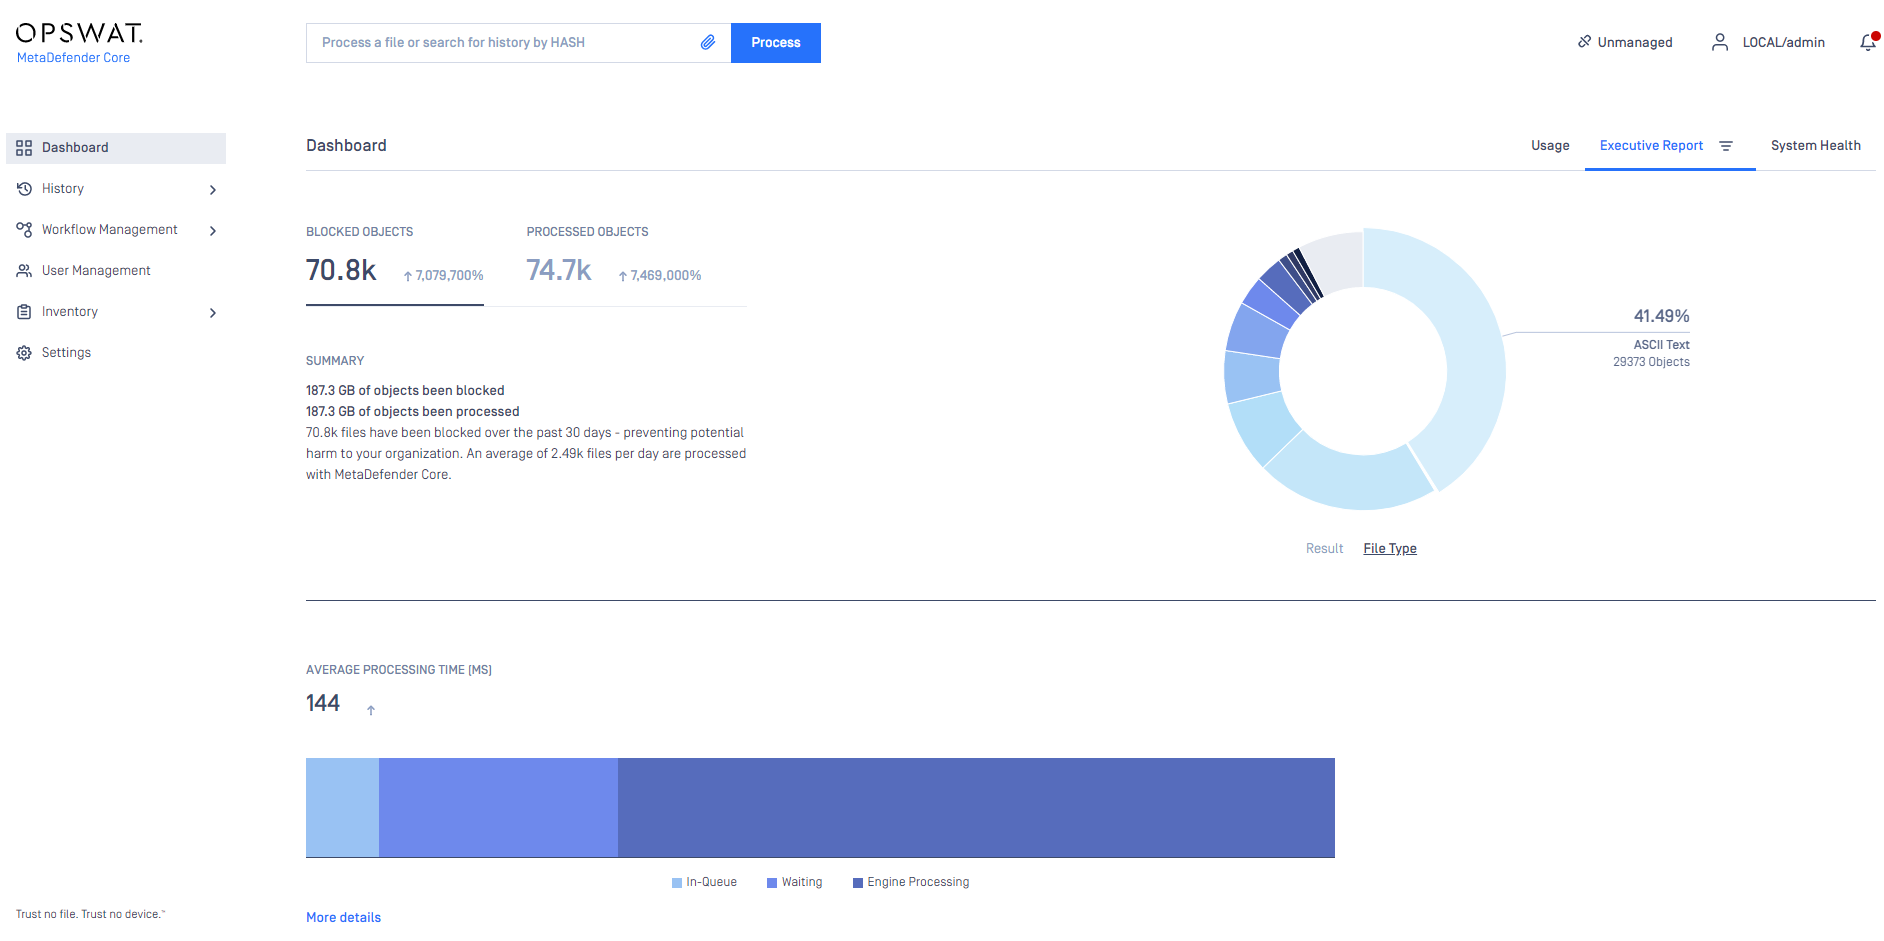
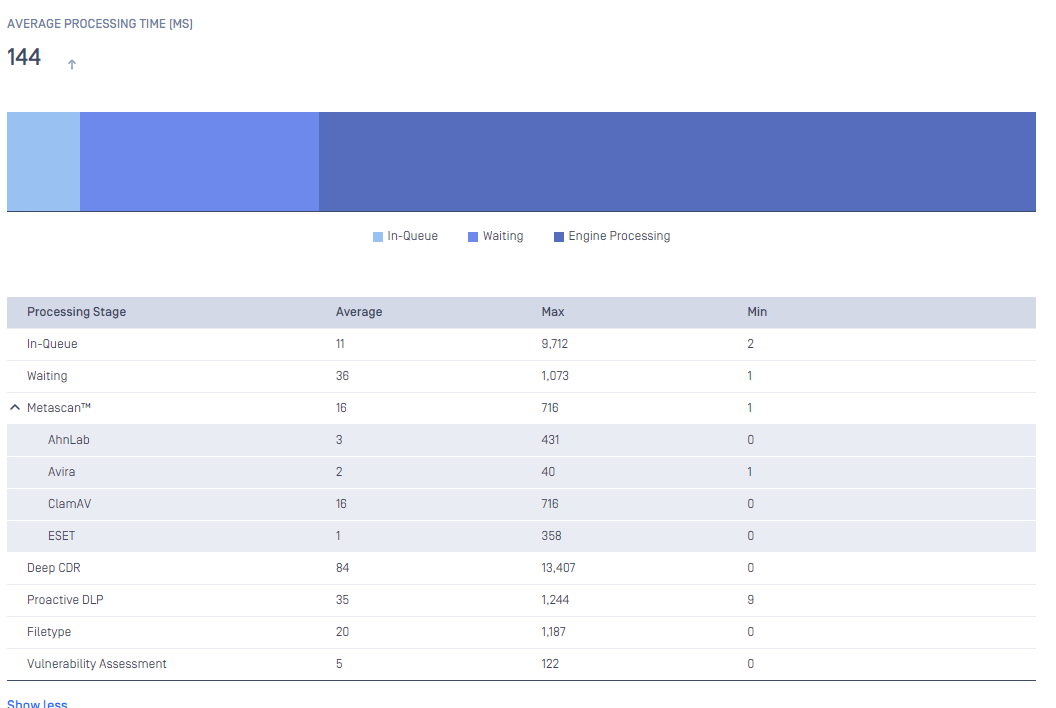
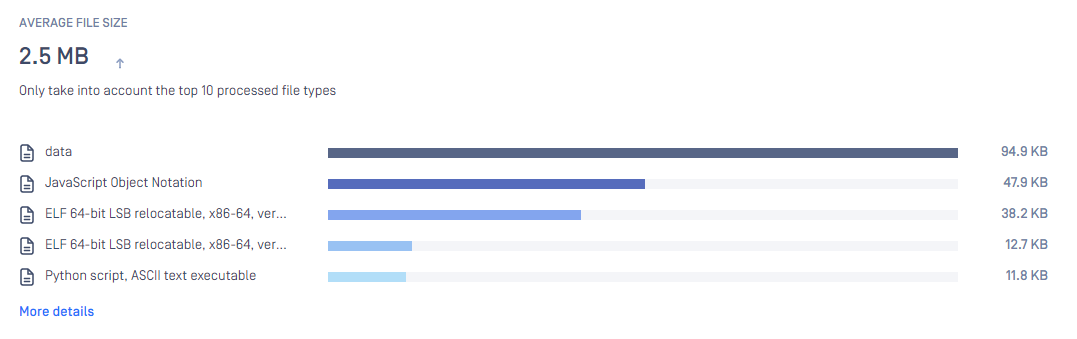
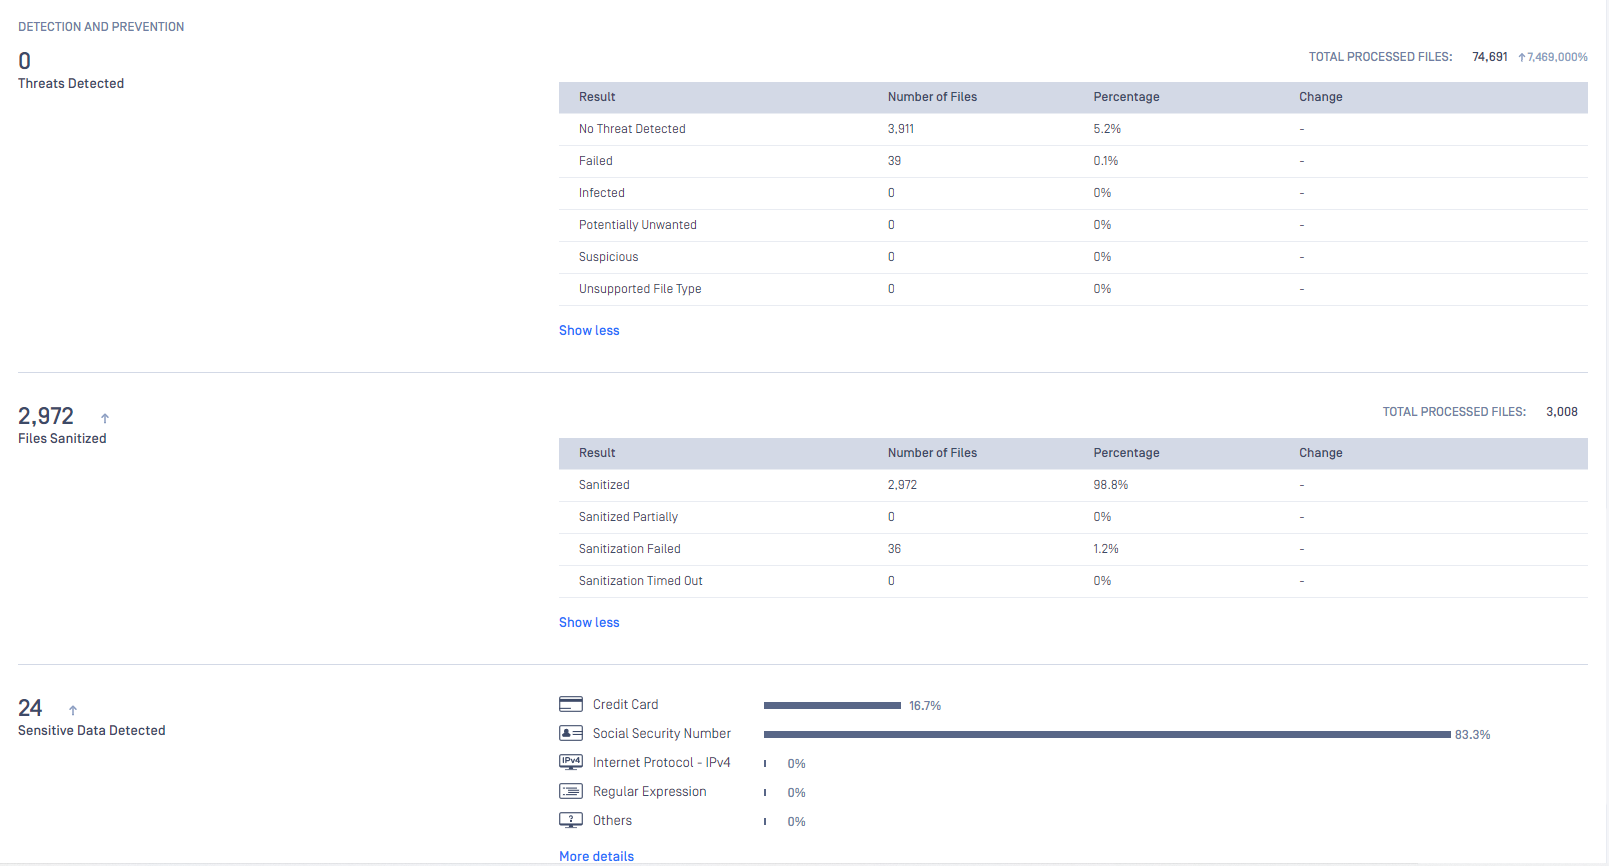
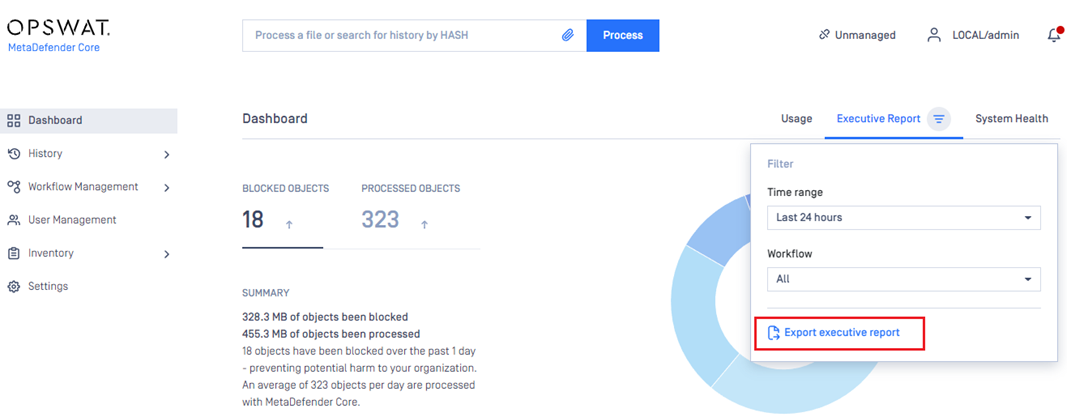
You can also export the executive report to PDF file for sharing:
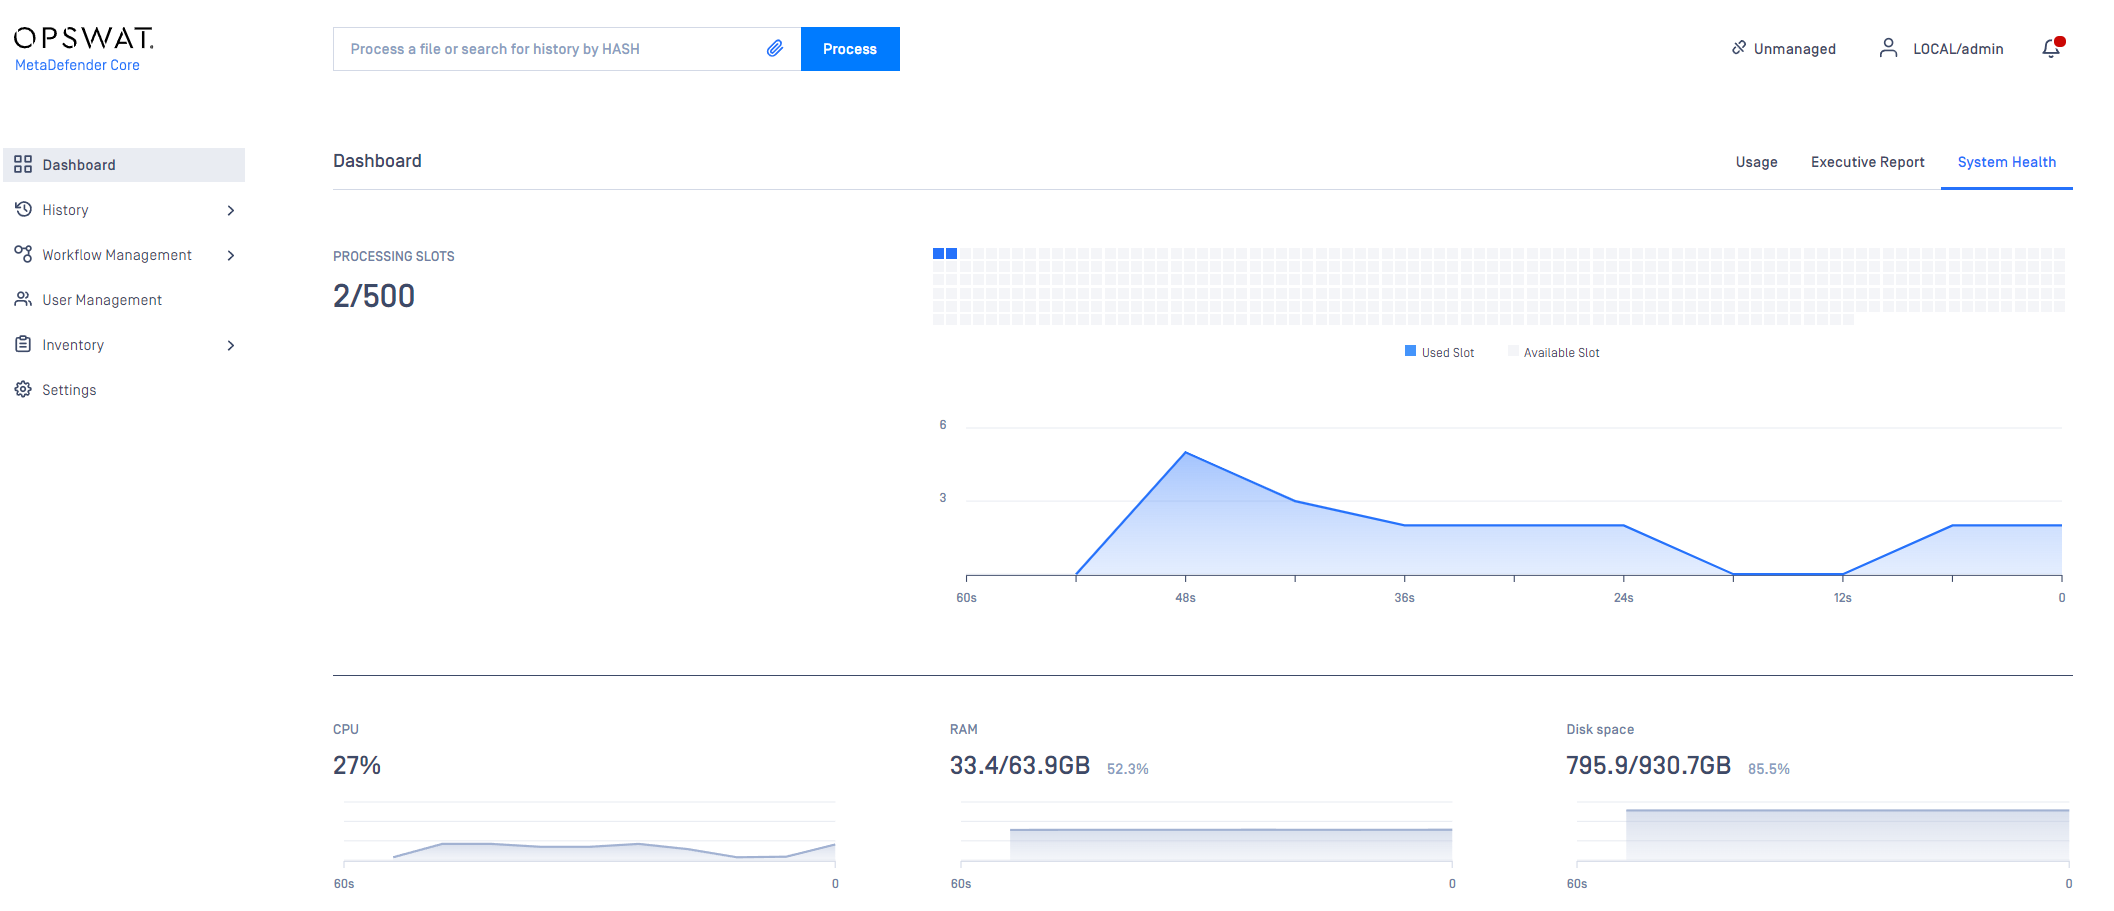
System Health
The system health page is to provide the current system resource status (CPU, memory and disk) and processing performance (scan queue) of MetaDefender Core server.
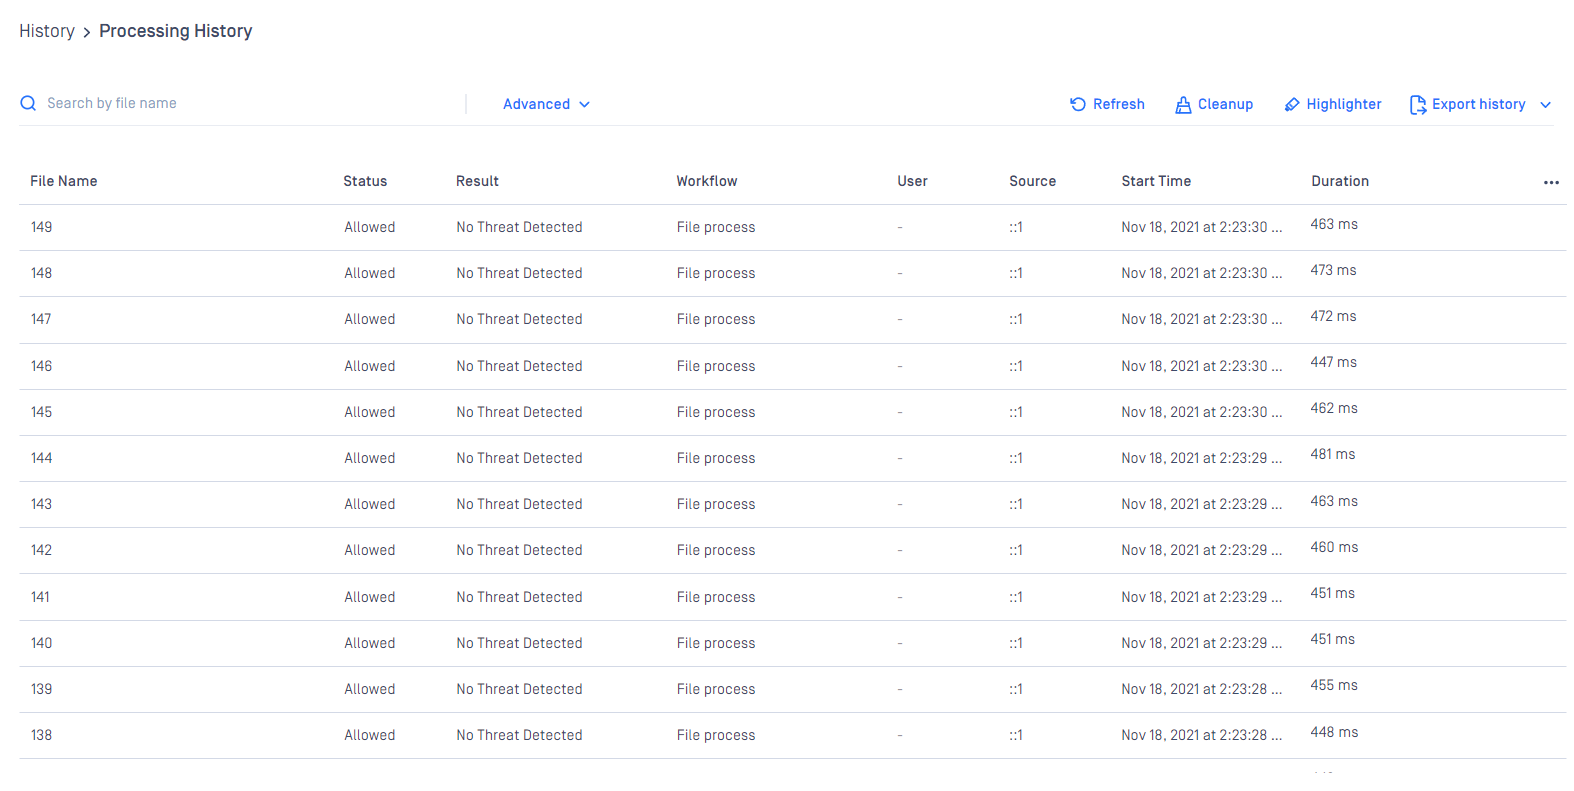
Processing history
The Scan History page shows information on all scans made on the MetaDefender Core. Search and filter are also supported against each scan result attribute.
If an archive was scanned, its details popup will include tabs for the original files scan details and also a list with the results of the contained files.
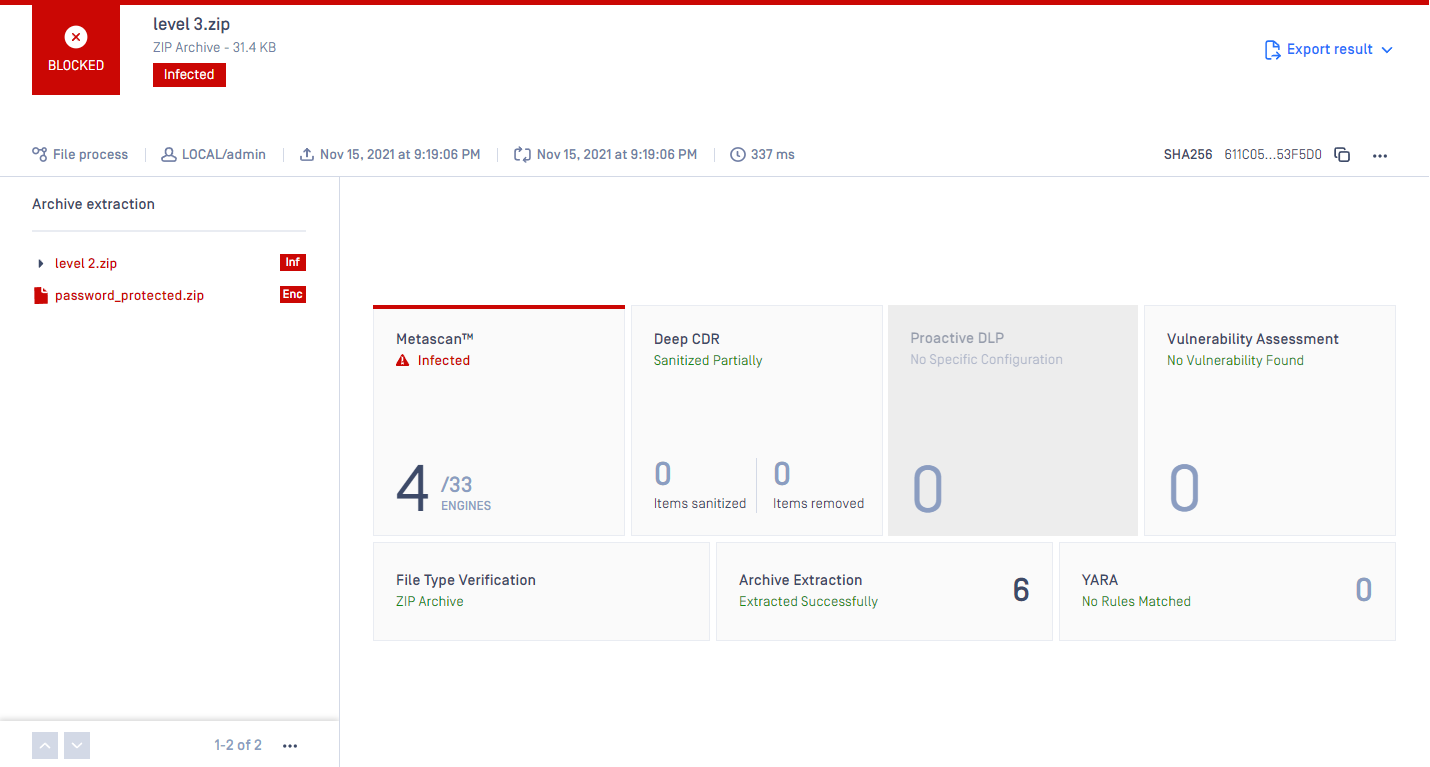
On the Processing history page you can also search for:
MD5, SHA1, SHA256 hashes
File name (and you can limit search result for a specific scan result, and for specific username who submitted files)
There is an option to export scan history in CSV or STIX format. For the export, the Result filter can also be applied.
The user can export STIX file by clicking on STIX export button. In addition to set Result filter, STIX file will contain only blocked scans. After the desired time range selected, the download will be started by clicking on the OK button.
CSV file is accessible by clicking on the CSV export button, and pressing OK after the desired time range selected.
Quarantine
The Quarantine page shows all scanned files which are copied to the quarantine. Each of them can be pinned to avoid removal on cleaning up. Also comments can be written to each quarantined file. Quarantine log can be searched for comment, file name and source of the scan request.
Update history
The Update history shows information on every update package related event.
On the Update history page you can also search for engine name, package type or message content. Also you can filter the list for severity.