Overview
This page assumes MetaDefender Core and Splunk are already installed and running. It only covers wiring the two together.
- The Splunk information is used on this page:
- Splunk Enterprise
- Version: 9.4.3
- Deployment: self-hosted container
- The MetaDefender Core version is any as long as it supports Syslog
The integration has two sides:
| Component | Action |
|---|---|
| Splunk | Open a syslog data input and route it into a dedicated index. |
| MetaDefender Core | Point its syslog logger at the Splunk host/port. |
Configure Splunk to receive syslog
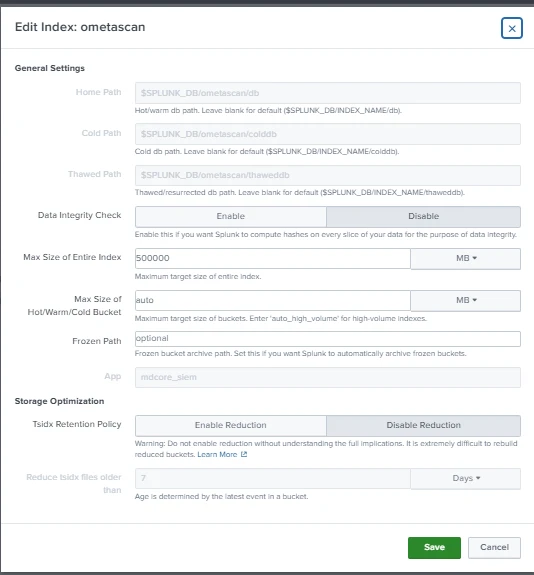
Create a dedicated index and a TCP (and/or UDP) data input that lands MD Core events in it. Add the following stanzas to your Splunk app's local config, or configure them via:
Settings > Indexes > New Index in the UI.
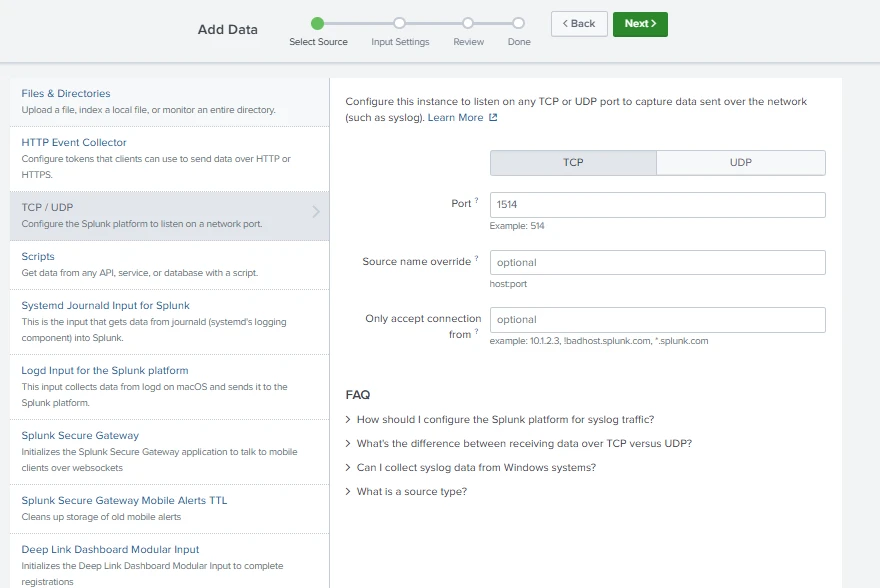
Settings > Data Inputs > TCP > + New in the UI.
- Protocol: TCP or UDP (It is recommended that the user use TCP because it is more reliable)
- Port: 1514
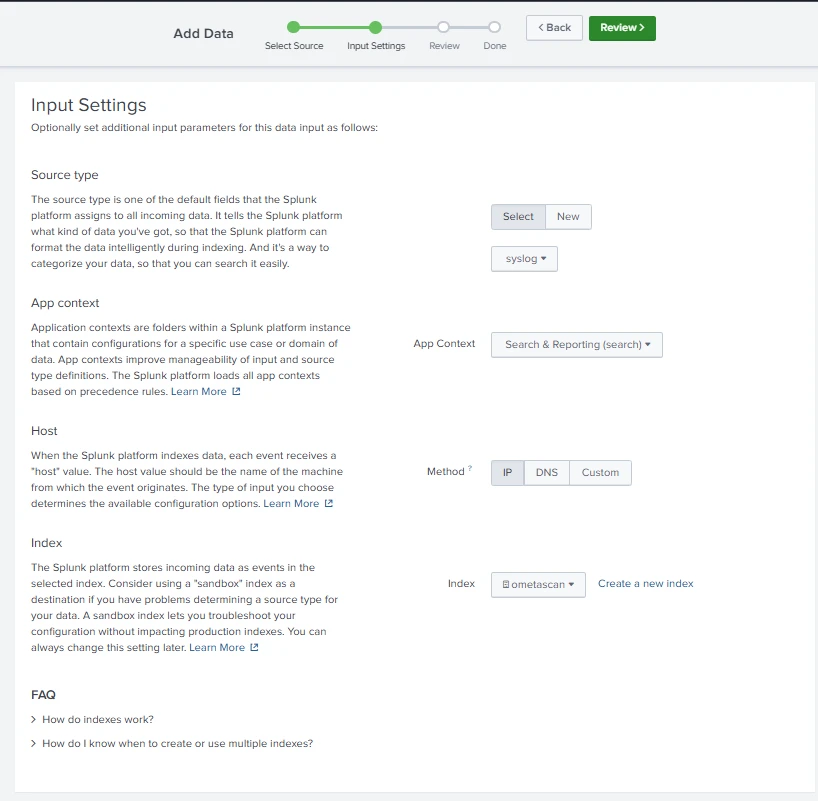
- Source type: syslog
- Method: IP
- Index: use the index name that is created in the previous step
Summary:
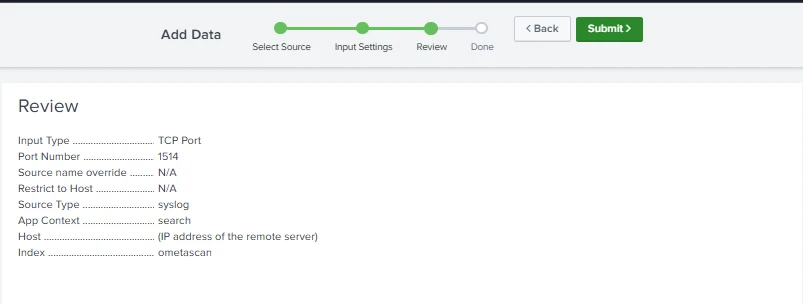
Point MetaDefender Core at Splunk
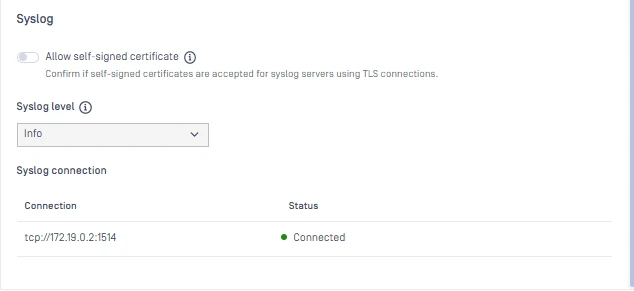
From the MetaDefender Core UI, go to Settings > Logs > click Edit and scroll down to Syslog > + Add a connection
Provide the IP address of Splunk and the port:
Verify
- In Splunk, confirm the input and index exist: Settings > Data inputs shows the 1514 TCP input, and Settings > Indexes shows ometascan.
- Since an idle MetaDefender Core sends nothing, run a scan in MetaDefender Core to generate events or restart the Ometascan service
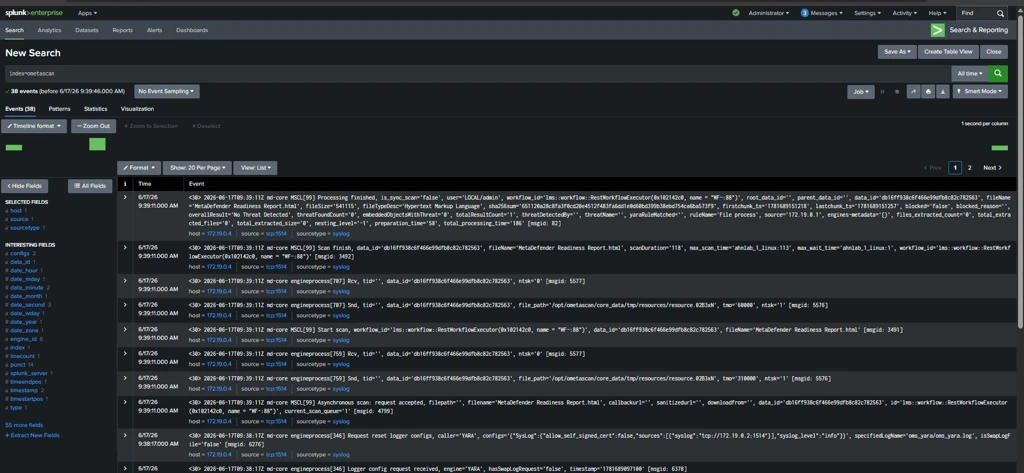
- Search in Splunk:
index=ometascan
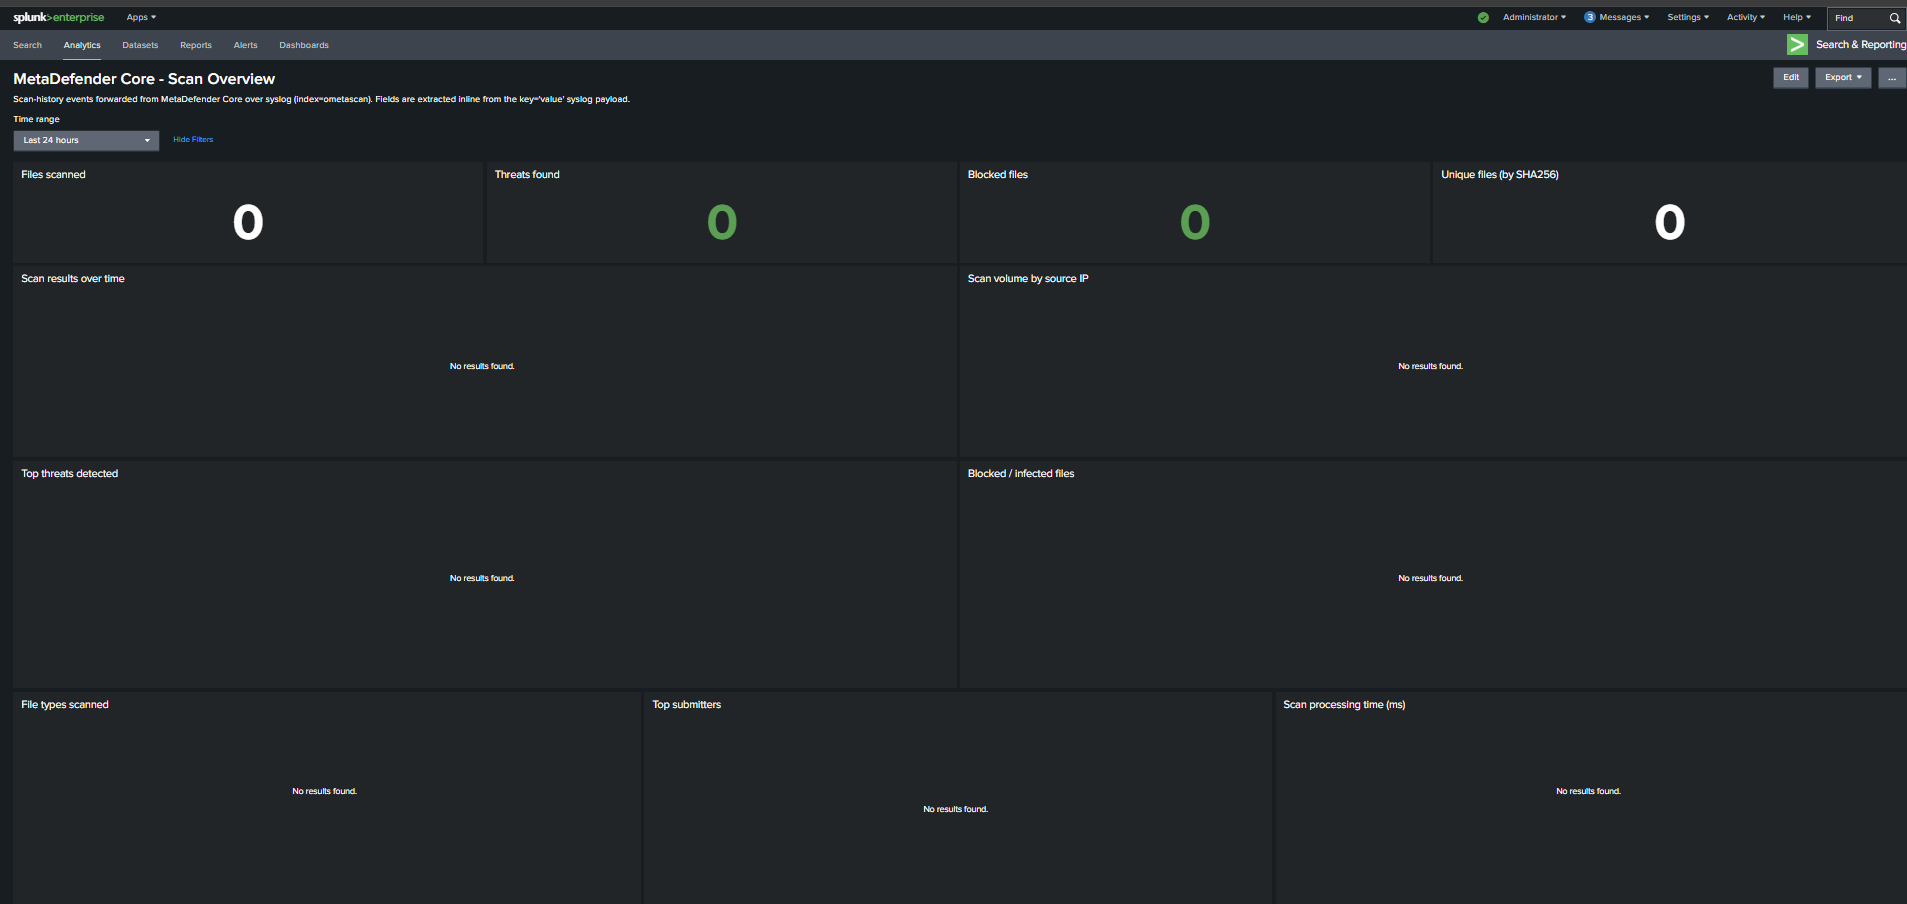
Splunk Dashboard
The user can customize the Splunk Dashboard for themselves. The following steps are to add the suggested dashboard from OPSWAT
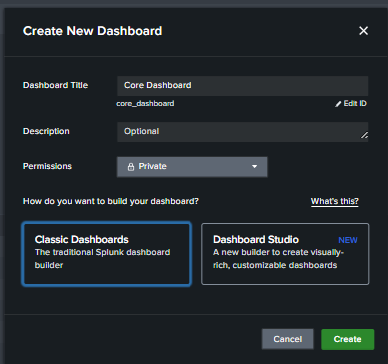
In the Splunk UI, go to Apps (top-left dropdown) > Search & Reporting > Dashboards > Create New Dashboard
Provide the dashboard name and choose Classic Dashboards
In Edit Dashboard, choose Source and use the following XML code, then click Save
<form version="1.1" theme="dark"> <label>MetaDefender Core - Scan Overview</label> <description>Scan-history events forwarded from MetaDefender Core over syslog (index=ometascan). Fields are extracted inline from the key='value' syslog payload.</description> <!-- Shared time picker drives the base search --> <fieldset submitButton="false" autoRun="true"> <input type="time" token="tr"> <label>Time range</label> <default> <earliest>-24h@h</earliest> <latest>now</latest> </default> </input> </fieldset> <!-- One base search (filters to completed scans + cleans the key='value' fields); every panel post-processes it, so the raw events are read once. --> <search id="baseScans"> <query>index=ometascan "Processing finished"| rex field=_raw "overallResult='(?<overallResult>[^']*)'"| rex field=_raw "source='(?<src_ip>[^']*)'"| rex field=_raw "blocked='(?<blocked>[^']*)'"| rex field=_raw "sha256sum='(?<sha256sum>[^']*)'"| rex field=_raw "fileName='(?<fileName>[^']*)'"| rex field=_raw "fileTypeDesc='(?<fileTypeDesc>[^']*)'"| rex field=_raw "threatName='(?<threatName>[^']*)'"| rex field=_raw "user='(?<user>[^']*)'"| rex field=_raw "total_processing_time='(?<total_processing_time>[^']*)'"</query> <earliest>$tr.earliest$</earliest> <latest>$tr.latest$</latest> </search> <!-- Row 1: KPIs --> <row> <panel> <title>Files scanned</title> <single> <search base="baseScans"><query>| stats count</query></search> <option name="drilldown">none</option> <option name="colorBy">value</option> </single> </panel> <panel> <title>Threats found</title> <single> <search base="baseScans"><query>| where overallResult!="No Threat Detected" | stats count</query></search> <option name="drilldown">none</option> <option name="rangeColors">["0x53a051","0xdc4e41"]</option> <option name="rangeValues">[0]</option> <option name="useColors">1</option> <option name="colorBy">value</option> </single> </panel> <panel> <title>Blocked files</title> <single> <search base="baseScans"><query>| where blocked="true" | stats count</query></search> <option name="drilldown">none</option> <option name="rangeColors">["0x53a051","0xf8be34"]</option> <option name="rangeValues">[0]</option> <option name="useColors">1</option> <option name="colorBy">value</option> </single> </panel> <panel> <title>Unique files (by SHA256)</title> <single> <search base="baseScans"><query>| stats dc(sha256sum)</query></search> <option name="drilldown">none</option> </single> </panel> </row> <!-- Row 2: Trends --> <row> <panel> <title>Scan results over time</title> <chart> <search base="baseScans"><query>| timechart span=1h count by overallResult</query></search> <option name="charting.chart">column</option> <option name="charting.chart.stackMode">stacked</option> <option name="charting.legend.placement">bottom</option> </chart> </panel> <panel> <title>Scan volume by source IP</title> <chart> <search base="baseScans"><query>| timechart span=1h count by src_ip</query></search> <option name="charting.chart">column</option> <option name="charting.chart.stackMode">stacked</option> <option name="charting.legend.placement">bottom</option> </chart> </panel> </row> <!-- Row 3: Threat focus --> <row> <panel> <title>Top threats detected</title> <table> <search base="baseScans"><query>| where overallResult!="No Threat Detected" | top limit=20 threatName</query></search> <option name="drilldown">none</option> <option name="count">20</option> </table> </panel> <panel> <title>Blocked / infected files</title> <table> <search base="baseScans"><query>| where overallResult!="No Threat Detected" OR blocked="true" | stats count latest(overallResult) as result values(threatName) as threats by fileName sha256sum | sort - count</query></search> <option name="drilldown">none</option> <option name="count">20</option> </table> </panel> </row> <!-- Row 4: Context and performance --> <row> <panel> <title>File types scanned</title> <chart> <search base="baseScans"><query>| top limit=15 fileTypeDesc</query></search> <option name="charting.chart">bar</option> <option name="charting.legend.placement">none</option> </chart> </panel> <panel> <title>Top submitters</title> <table> <search base="baseScans"><query>| stats count by src_ip user | sort - count</query></search> <option name="drilldown">none</option> <option name="count">20</option> </table> </panel> <panel> <title>Scan processing time (ms)</title> <chart> <search base="baseScans"><query>| timechart span=1h avg(total_processing_time) as "avg ms" p95(total_processing_time) as "p95 ms"</query></search> <option name="charting.chart">line</option> <option name="charting.legend.placement">bottom</option> </chart> </panel> </row></form>The following is the dashboard after being created: