
Connection Sessions
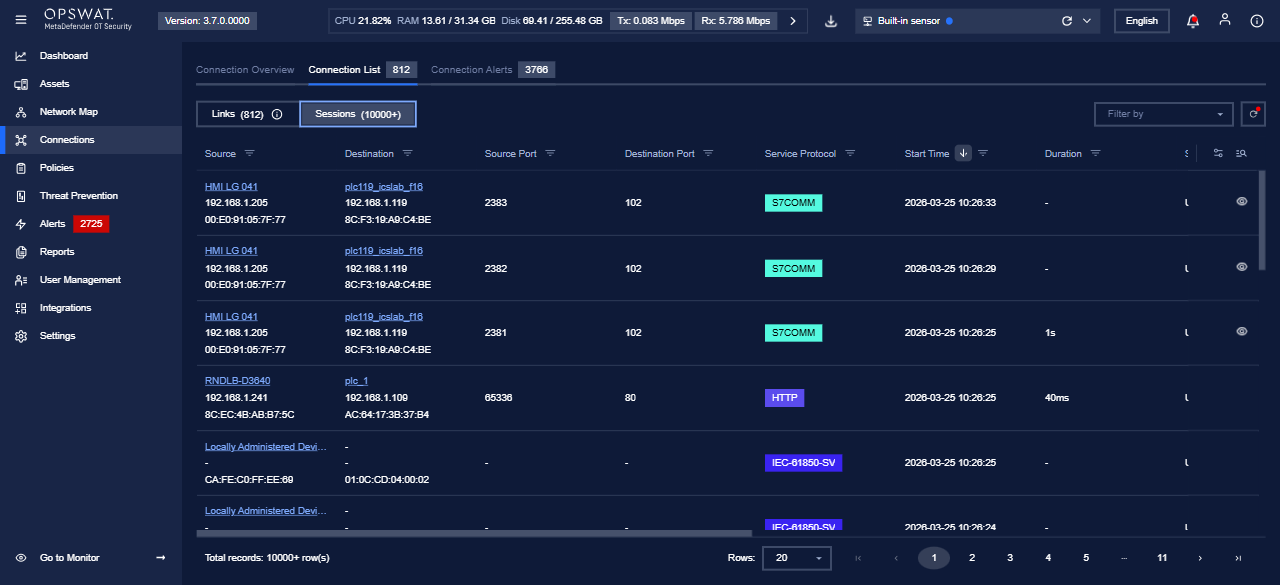
Connection Sessions lists active and recent sessions for the scope you have selected (for example a sensor). Use it to inspect how devices are communicating for a period the product defines. Labels and columns follow your installed version.
Before you start
Step | What to do |
|---|---|
1 | Open the MetaDefender OT Security web address your administrator gave you and sign in. |
2 | Open Management so you can use Settings (for example via Go to Management). |
3 | In the header, pick the enterprise, site, or sensor scope that matches what you want to document or troubleshoot. |
Opening Connection Sessions
Step | What to do |
|---|---|
1 | In the sidebar, open Settings. |
2 | Open the tab that lists connection-related tools—often Component or the closest match in your build. |
3 | Click Connection Sessions (wording should match the UI). |
Main grid
The screen is usually a table of sessions (source and destination, protocol, state, time, and other columns). Filter or search when those controls are available.
Notes
- Session retention and which fields appear depend on policy, version, and role.
- For views that cover more than one sensor, switch the header scope to Enterprise or the right site when your environment offers that option.