Operating
The Site dashboard is accessible by selecting the Site and clicking the Overview icon.
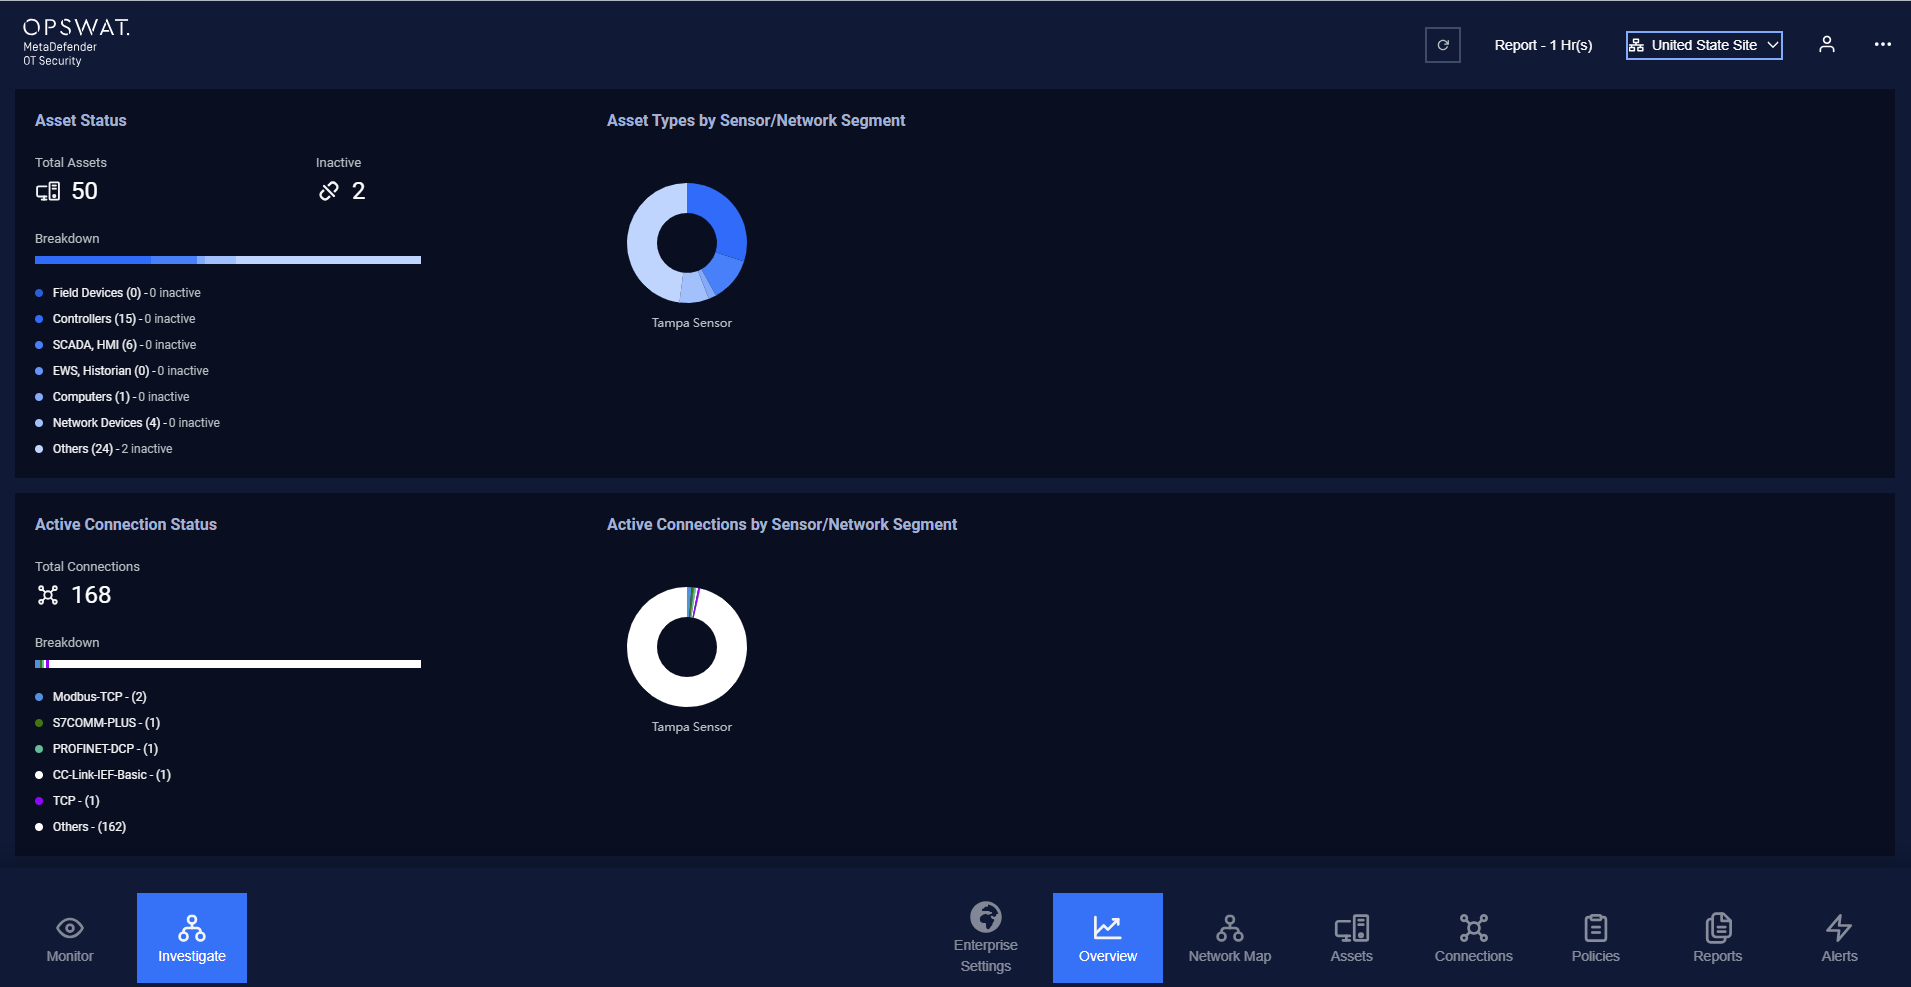
The Site dashboard serves as a comprehensive system overview, presenting information from all sensors to help users easily understand and monitor devices. It displays the Alert Status, Asset Status, and Active Connection Status of all sensors, along with graphs for each sensor.
Was this page helpful?